
The Railway Hallucination: The Infrastructure That Outlived Its Shareholders
Why the AI infrastructure boom is bound to the same arithmetic of the 1840s British Railway Mania and What it Means for Your 401(K)

Capital Misallocation™ · Essay #3
The 3rd of 50 essays on Capital Misallocation™. The Mississippi essay was about how Systems form. The South Sea essay was about how forced buying works. This one is about what happens after. It’s the first case in the series that ran all the way to resolution: the technology was real, the infrastructure survived, and the equity owners still got destroyed. This is the case where we already know the ending. And the ending is the thesis. Note the key indicators monitor sits at the end of the essay if you are only looking for what to watch today.
In 1844, a draper’s apprentice from York controlled a third of Britain’s railway network, sat in Parliament, and had a wax figure in Madame Tussaud’s. His name was George Hudson, and they called him The Railway King.
Five years later the empire was gone, the wax figure melted down, the street bearing his name renamed. Hudson served three months in York Castle debtors’ prison and died in a London lodging house in 1871 worth less than two hundred pounds.
Between his apex and his ruin, Britain’s private sector deployed more capital per unit of GDP than any private enterprise in recorded history. Total capex during the British Railway Mania of the 1840s ran to roughly £250 million over the decade, nearly half a year’s national output. In the peak year of 1847, capitalists plowed £44 million into tracks and earthworks alone, more than twice the Crown’s military budget. Railway equities went from 23% of UK stock market value in 1838 to as much as 71% a decade later. Then the music stopped. Which is the one thing Chuck Prince tried to explain to the Financial Times two decades ago.
“When the music stops, in terms of liquidity, things will be complicated. But as long as the music is playing, you’ve got to get up and dance. We’re still dancing.”
~ Chuck Prince, Former CEO of Citigroup
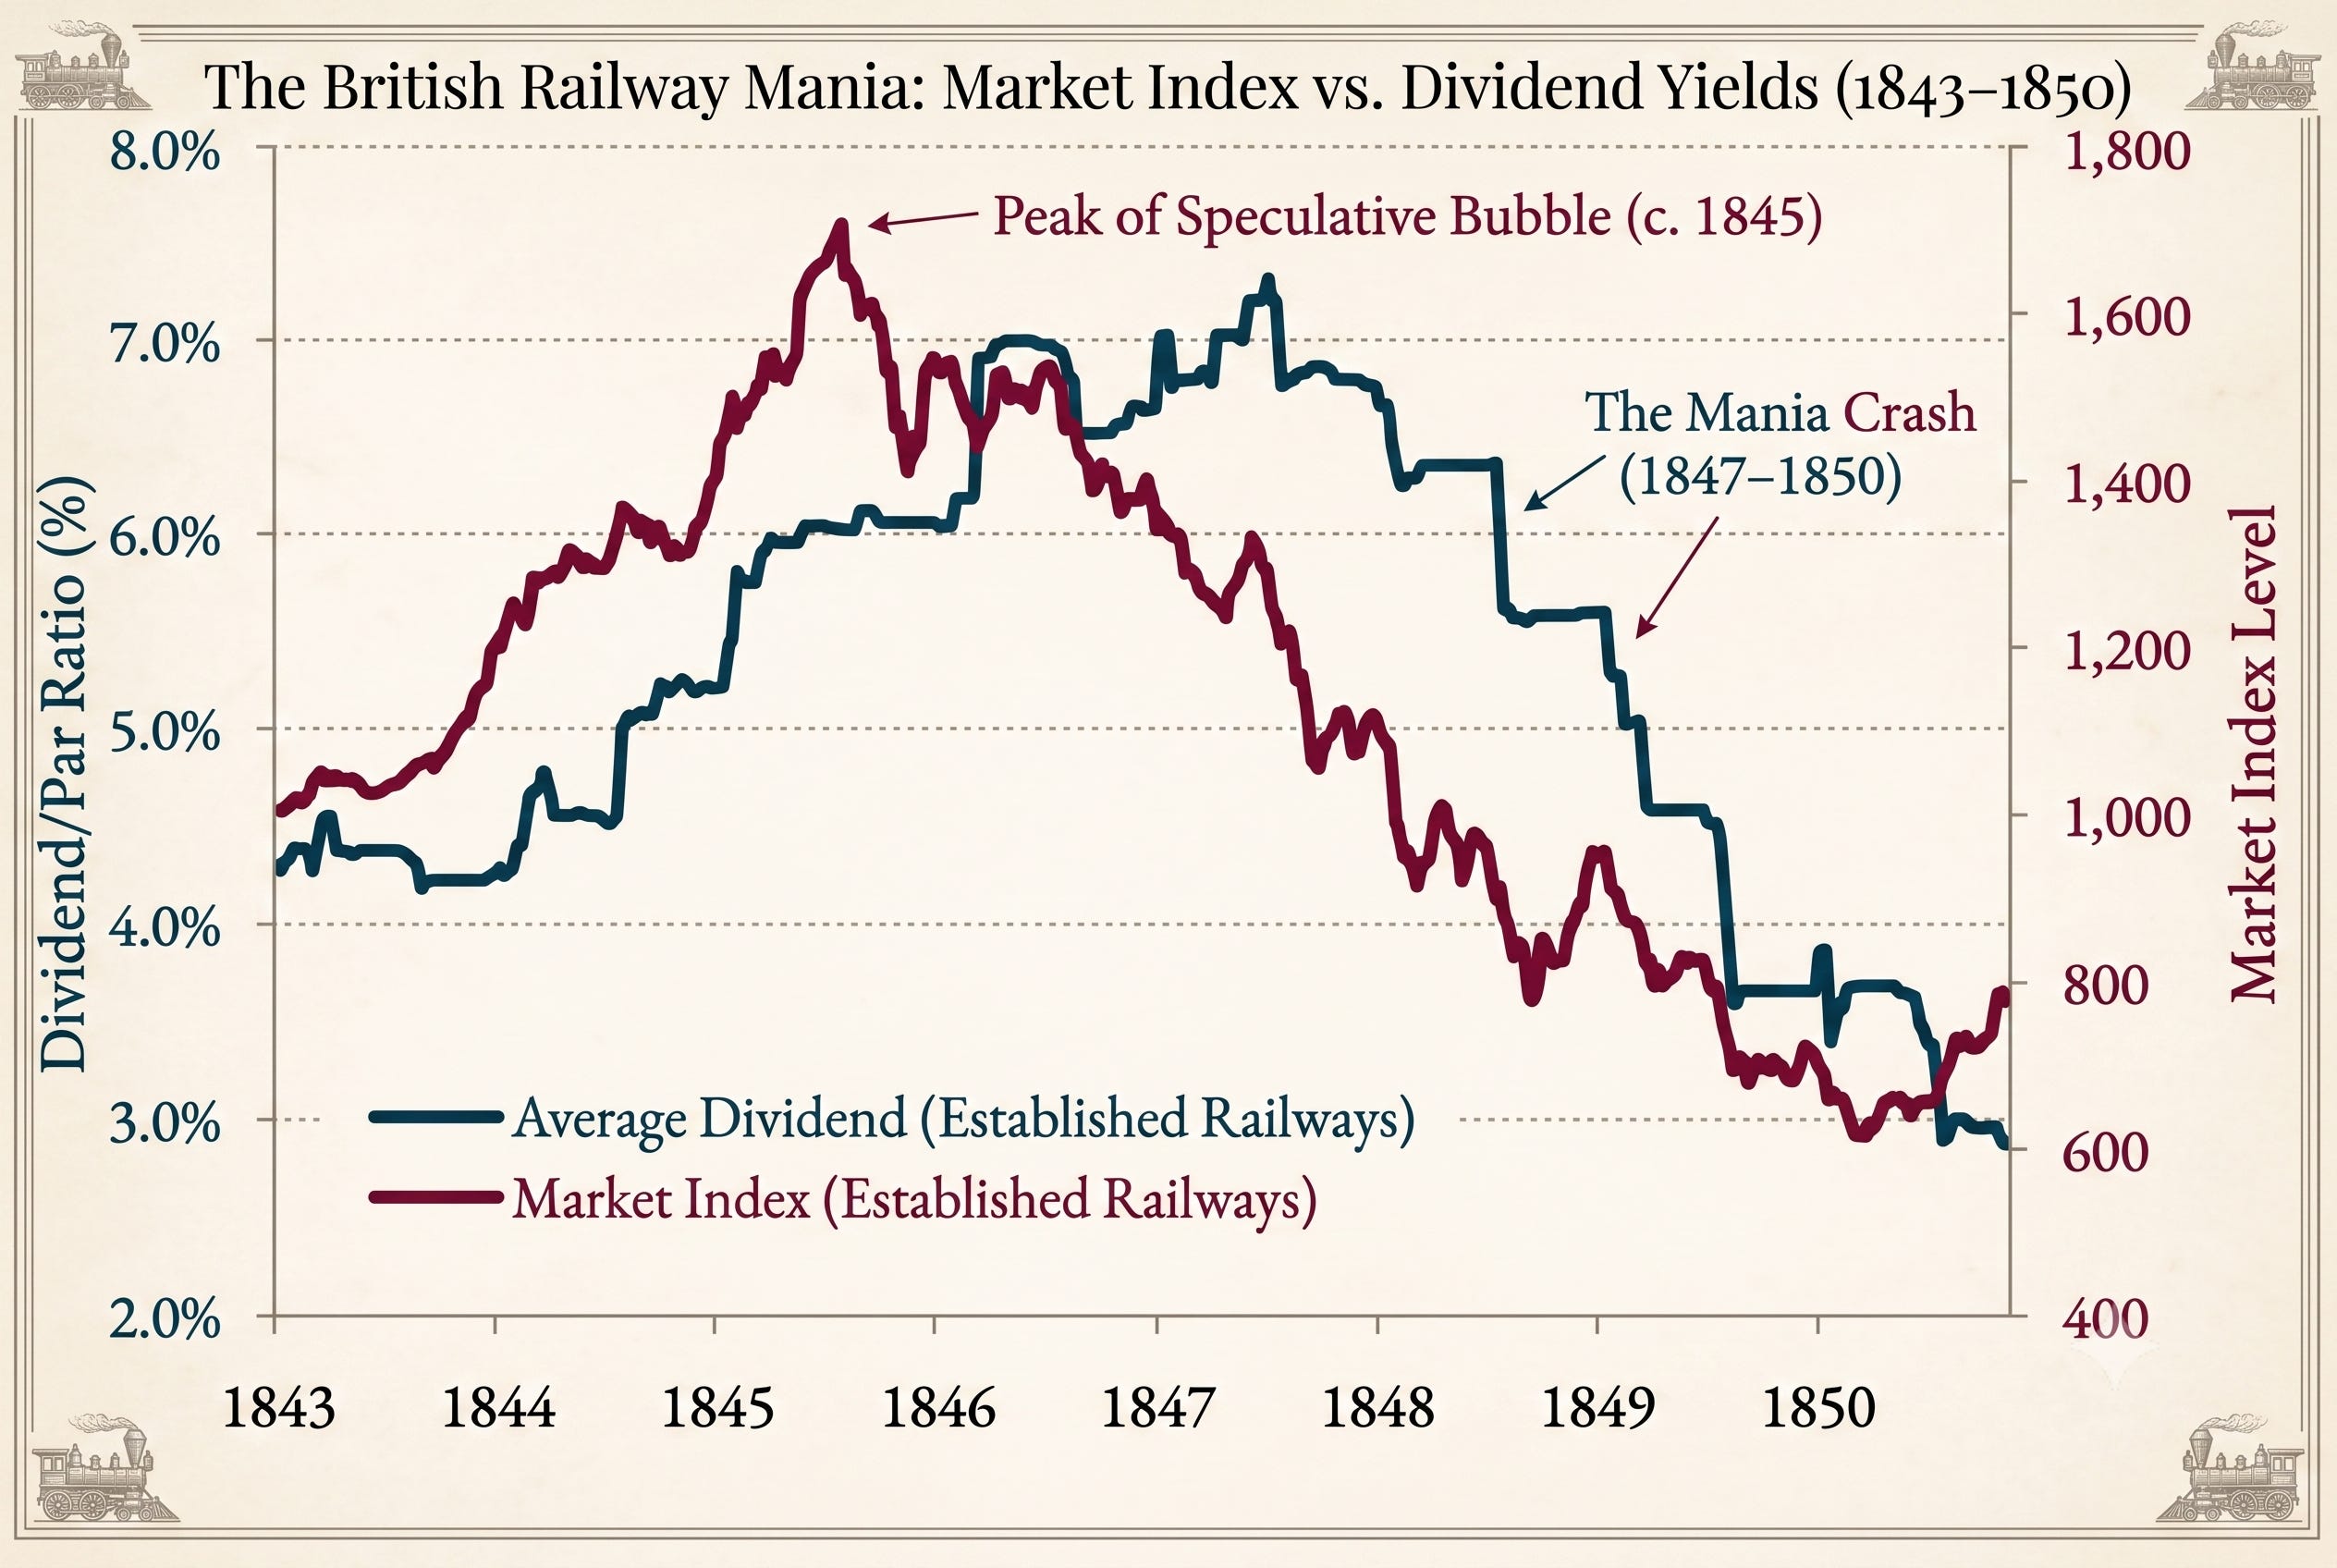
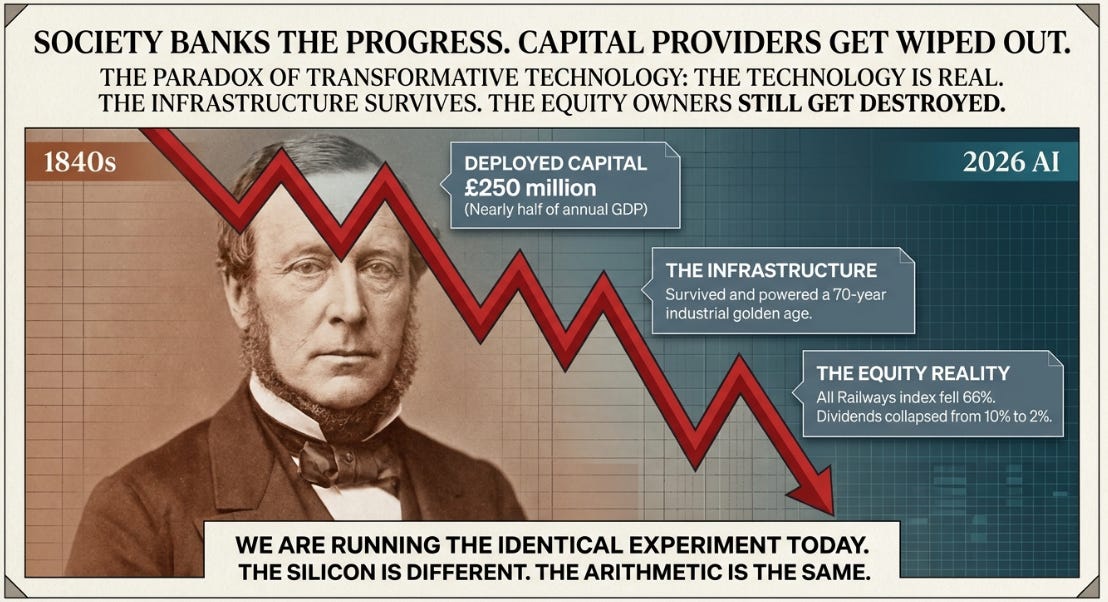
Railway dividends collapsed from 7-10% to 2%. The All Railways Index fell 66% peak to trough. Crashes are nothing new. Here’s the part that should keep you up at night if you own anything AI-adjacent, equity or credit - almost all of it survived. The railway network that crushed its shareholders in the late 1840s went on to power British industrial dominance for the next seventy years. Society got its revolution but the people who funded it got crushed.
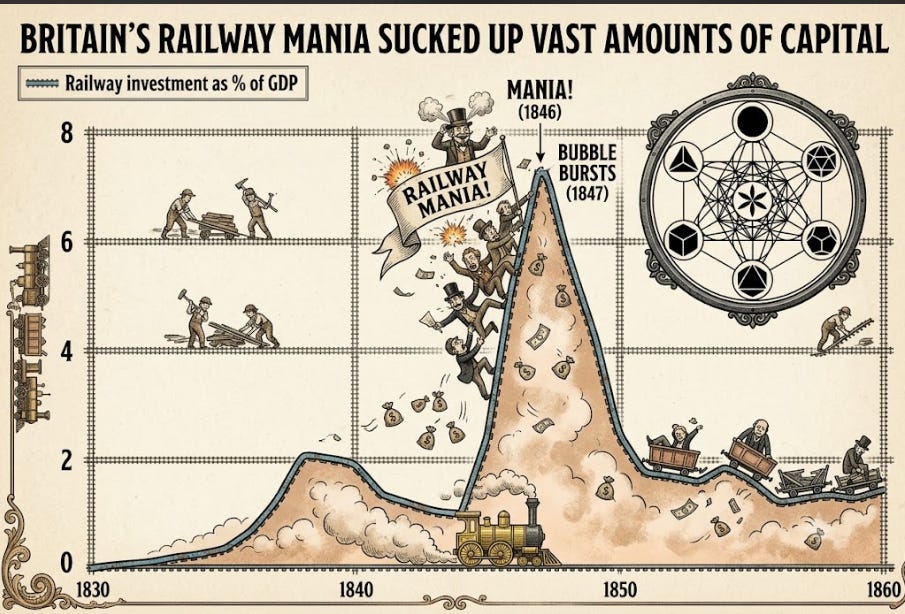
Others have recently mapped the AI capex cycle to 2008, an analog I am sympathetic to given the credit plumbing potential for a liquidity squeeze amplifying the duration mismatch present today. Groundbreaker Research has recently put out two excellent articles arguing this point if you are interested in more detail. But subprime was a fraud wrapped in leverage on US housing - a non-productive asset. The better precedent is a period that featured infrastructure to support a real technology, genuinely adopted, that still vaporized a decade of national savings. That’s the core message of this essay.
The technology can win, the infrastructure can survive, and the invested capital can still be destroyed. All three at once.
Andrew Odlyzko, the mathematician who spent over a decade reconstructing the Railway Mania’s books, called it “by many measures the greatest technology mania in history” and its collapse “one of the greatest financial crashes.” Odlyzko concluded Investors had all the data they needed to avoid it. His argument was that they chose not to use that information because they couldn’t wean themselves off the high of daily higher prices. The FOMO of 1840’s Brittish markets is echoed today in semiconductors and memory stocks right now that are massive beneficiaries of this current AI Infrastrcture Investment Boom.
We are running the same experiment. The silicon is different but the arithmetic rhymes.
The Capital Misallocation Severity Score
After the first two essays I built a scoring system to compare these episodes apples-to-apples. The Capital Misallocation Severity Score, or CMSS: 56 cases spanning 392 years from the Dutch Tulip Mania of 1634 to the AI Investment Boom, scored across eight dimensions weighted by systemic risk, producing a composite from 0 to 100. Every case is validated against Kindleberger-Minsky, Ole Peters, Reinhart-Rogoff, and Hsieh-Klenow. Full methodology and all 56 case cards are in the chart book below the paywall.

One note on why The 1840s Railway Mania doesn’t score higher on my CMSS scoring where Odlyzko claims it was one of the largest ever as mentioned above. CMSS ranks structural severity weighted by transmission and Odlyzko measures the share of national capital absorbed. The Dot-Com scores higher (96) than the Railway Mania (86), not because it was a bigger mania, but because its amplification channels were more potent.
While most investors tend to pattern-match to the wrong analog reaching for 1929 or 2008, which are both complete Kindleberger cycles that ran all the way to the revulsion bottom. The more dangerous scenario is the mid-cycle distress event: 1846 before the 1847 crash, 1999 before the air came out, or Q2 2007 before the GFC. CMSS puts the current AI capex cycle at the same stage as the Railway Mania.
The Railway Mania scores 86, above the two episodes we have written about so far - the Mississippi Bubble (65) and the South Sea Bubble (56). The reason for this is that the capital deployed was larger, the misallocation ran longer, and the recovery was only partial. The AI Investment Boom scores 74 and is still climbing, because capex plans have not even decelerated. However, it is worth noting that the last six weeks have started to shake the bulls’ confidence.
ACT ONE: THE RAILWAY KING
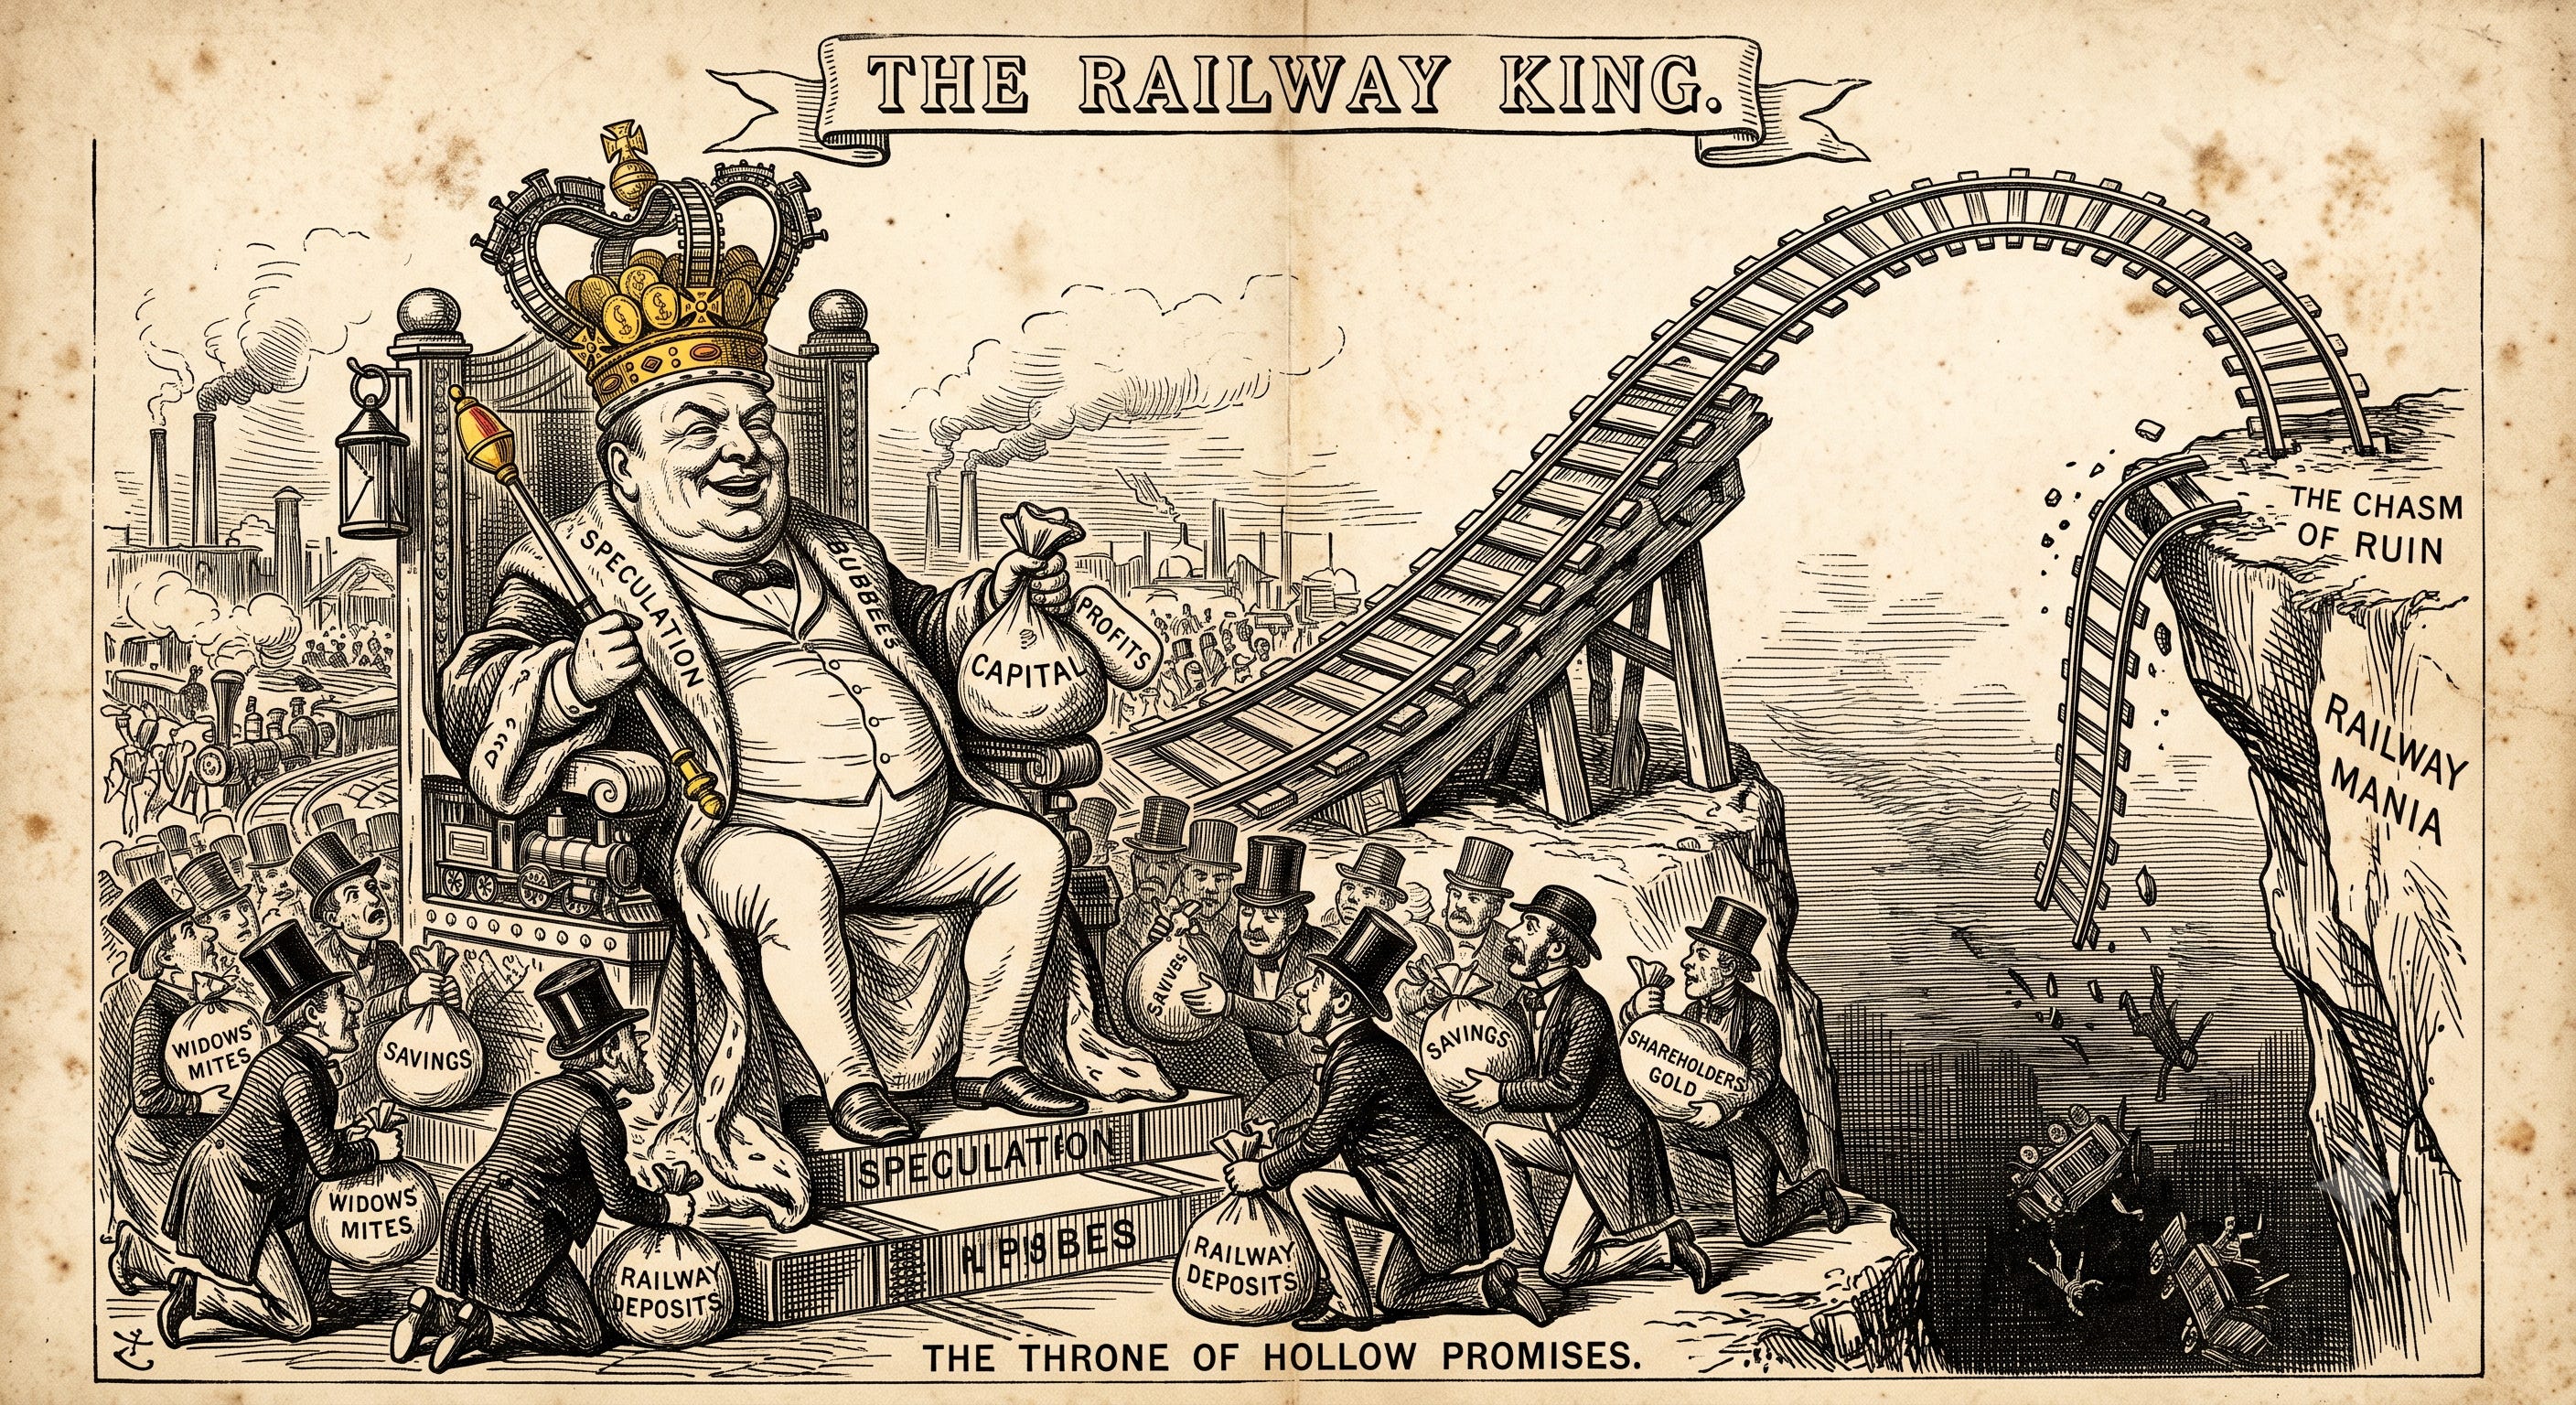
George Hudson was born in 1800 in Howsham, Yorkshire, fifth of ten children of a tenant farmer. He apprenticed as a draper in York and married into the firm, a provincial nobody. Then in 1827 his great-uncle left him £30,000, roughly £2.7 million today.
“The inheritance was the very worst thing that could have happened to me. It let me into the railways and all my misfortunes since.”
~ George Hudson
Hudson poured it into the York & North Midland Railway and never looked back. Not so different from the chaps who launched the DRAM ETF with $250k in March 2026 that now runs $25bn of AUM and $20m of monthly revenue. By 1844, when Sydney Smith crowned him The Railway King, Hudson controlled a third of the British railway network. He took the Conservative seat for Sunderland the following August, bought estates across England, and chaired multiple companies.
He had discovered the most dangerous truth in capital markets, the same one John Law found a century earlier and the AI complex is finding now:
If you control both the product and the accounting, you can manufacture the appearance of prosperity for as long as fresh capital keeps arriving.
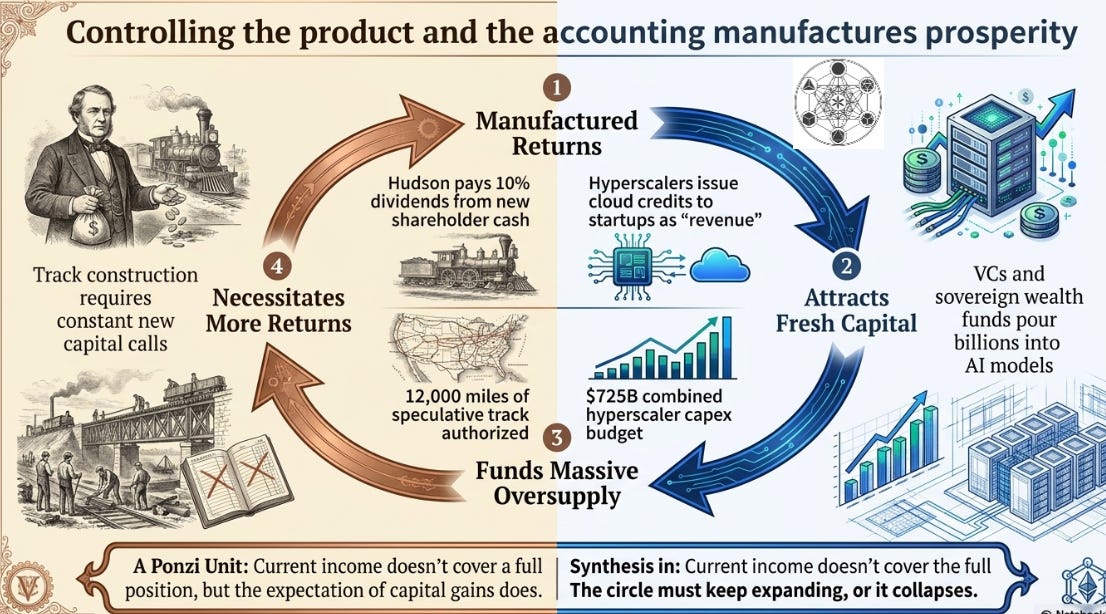
The Railway King’s method was simple. The York & North Midland paid dividends of 8-10%, extraordinary yields that pulled in wave after wave of new investors. Carry pulls in capital at an increasing rate as the trend persists; it’s nearly as immutable as gravity. The best explanation and analysis of this can be found in Lee, Coldiron, and Lee’s The Rise of Carry. The problem Hudson faced was that his railways were still under construction and couldn’t throw off enough cashflow to pay the fat dividends that were attracting the capital. So, like any Ponzi promoter, Hudson paid them out of capital, the money new shareholders put in, not money the railways earned.
He kept no formal accounts and got away with it for awhile as his word “was allowed to guarantee everything.” When his companies needed iron, he sold it to them at a markup and when their shares sagged, he had the companies buy back their own stock with loans from friendly bankers.
He wasn’t alone in the financial circularity. The contractors Samuel Peto and Thomas Brassey took payment in the shares and bonds of the railways they were building, financing demand for their own services. Peto actually survived the Mania only to blow up during the Overend Gurney crisis of 1866. The circular funding loop that readers of The New Mississippi know from Nvidia-CoreWeave-OpenAI, Google-Broadcom-Anthropic, and MSFT/ORCL-OpenAI has is not a new phenomenon - its as old as capital markets.
Hyman Minsky’s key insight, which was heterodox then but is mainstream now, was that the financial system is not exogenous as mainstream economics teaches but in fact endogenous. An endogenous process means the cycles and crises witnessed over time are generated internally not the result of an external shock. Initial success yields overconfidence that then introduces leverage, and leverage breeds fragility. His framework identifies three borrower types - Hedge, Speculative, and Ponzi. The Ponzi unit is not necessarily a crime but rather a posture - a borrower who needs fresh capital just to cover the cost of capital. That was George Hudson during The 1840s Railway Mania. After the tide went out on the bubble, The Committee of Investigation later found roughly £600,000 of fraud and dividends paid straight from capital. The theft wasn’t the issue.
The deep problem was The Structure.
The dividends attracted the capital that then funded the construction that was supposed to earn the income to justify the dividends. As always, the circl had to expand or collapse.
It collapsed.
In February 1849, shareholders of the York, Newcastle & Berwick demanded an investigation when the books wouldn’t reconcile and then the inquiries cascaded as tends to happen when the tide goes out.
George Hudson’s spectacular rise was matched by an equally dramatic collapse where he resigned his chairmanships, sold his estates, gave up his seat in Parliament, lost his seat in Parliament, had his street renamed, his Maddam Tussaud’s statue melted down, and, like John Law, fled the country before eventually returning and being put into a debtors’ prison.
The casualties are sometimes more instructive than the villain. Charlotte Brontë, author of Jane Eyre and the Isaac Newton of this episode, held shares in Hudson’s York & North Midland. She bought near the top and watched the price bleed from around £120 toward £20, writing to her publisher that “the little bit of money I had... had melted.” No panic, no heroic last stand. Just the quiet arithmetic of capital that can’t earn its cost, compounding against whoever supplied it.
I am not opening up this with Hudson because he’s the point of the story, rather he’s the archetype of this episode, like John Law and John Blunt were in my previous two essays.
The point of the story is the machine he sat inside.
ACT TWO: THE MACHINE
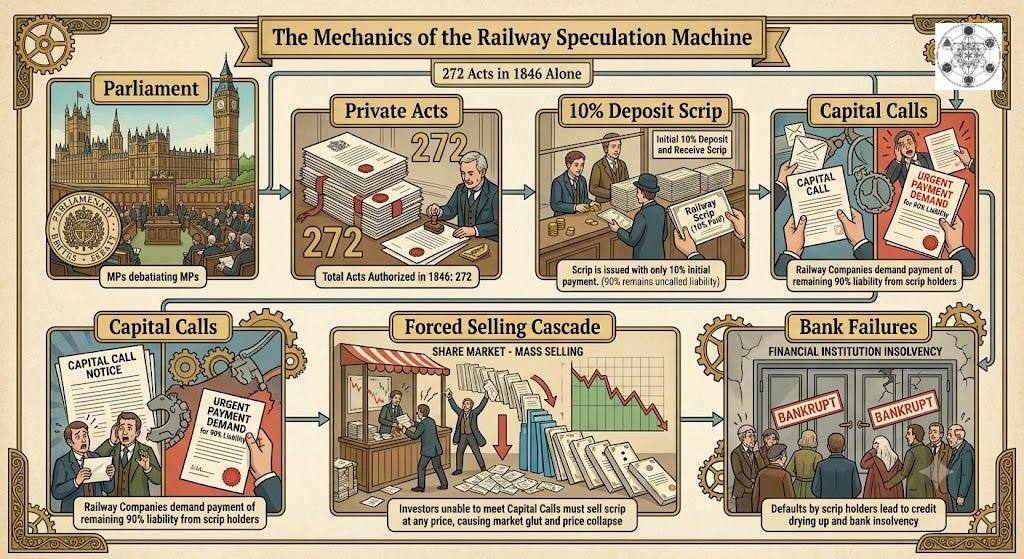
Every railway line in 1840s Britain needed its own private Act of Parliament to get the green light. Each company petitioned for the right to exist, buy land, and then lay track. Parliament judged the bills in subcommittees of five MPs and voted them through with no test of financial viability whatsoever - apropos for politicians throughout history up to today. In 1846 alone, Parliament passed 272 Railway Acts authorizing roughly £132 million across 9,500 miles of proposed routes.
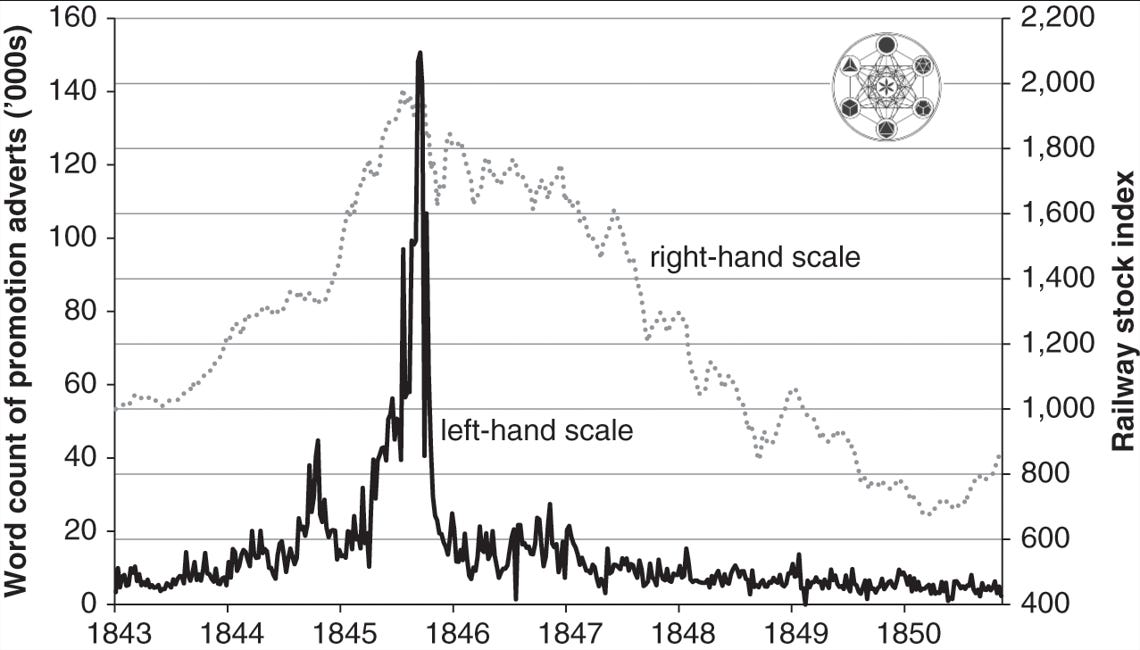
The media ran on the same program as the money flows naturally. Campbell, Turner, and Walker actually went back and counted the words in railway promotion adverts week by week. The count went vertical into the October 1845 peak of 150,000 words of prospectus a week only to collapse 90% within months. The share index took four more years to bottom but the media hype marked the top as it has for the numerous rolling bubbles we have seen in the Twitter Era of markets from the micro to the macro level. Mark that sequence, because it inverts how most people read sentiment typically. The hype dies at the top yet the price die slowly, for years, in silence, long after the promoters stop buying ink. When the AI funding-announcement machine goes quiet, that won’t be the all-clear. It’ll be 1846. The only questions are the terminal value and the decline curve.
Translation: “Where is the actual bid that reflects fundamental value and what is the rate and shape of the decline?
It was self-dealing, not passive neglect.
Esteves and Mesevage used social-network analysis to show that vote-trading among railway-invested MPs influenced at least a quarter of all approved lines during the mania period. The companies that owed their existence to that horse-trading underperformed the market during the bubble and after the crash. Parliament’s imprimatur, supposedly the quality filter, was itself contaminated. The modern rhyme is testable on this dimension. Let’s watch whether the AI names whose largest revenue is federal contracts underperform when the correction comes. The Squirrel is in my head telling you to take notice that SpaceX fell below deal price today. I would argue that one carries the highest R-square to this self-dealing dynamic present back then as well.
LEVERAGE…ITS ALWAYS LEVERAGE
While self-dealing definitely played a role in this historical financial drama, the real engine was a familiar financial architecture. We have to recognize that 1840s railway investors didn’t buy the shares outright. They bought partly-paid scrip, subscription certificates requiring a small deposit, with the balance to be called later as construction progressed. The researchers seem to disagree on the exact deposit percentage as 2%, 5%, and 10% all appear but that doesn’t matter.
It’s the mechanism, not the percentage.
Campbell actually was able to quantitatively illustrate that the partly-paid shares were derivative-like instruments that tracked fully-paid equivalents at a leverage multiple. I laugh so hard thinking about today’s market with 2-3x levered ETFs “tracking” the underlying fully collaterized paper when I write abou this 1840s story. Basically, the same £2 move produced an outsized gain on the deposit actually paid initally and simimlar magnitude when it eventually ran in reverse. Remember, leverage is a two edged sword that is fantastic on the way up but extremely dangerous on the other side. As capital calls came due, the obligation to pay directly leaned on prices via a a step function decline curve, not a smooth curve that most like to imagine exists on the other side. Ask 2026 silver bulls about that one if you don’t believe me.
It was precisely this leverage that made the whole Mania negatively convex: fixed upside, unbounded downside, and payments that kicked in regardless of price.

Notice what the 1845 buyer thought he was purchasing. Not cash flows but rather membership or participation in modernity itself. That’s the product being sold today as always - the frontier, the future, the hype.
They put down a deposit on scrip for a railway that didn’t exist yet filled with excitement and hope. If the line looked promising, the scrip traded at a premium and you flipped it without ever putting up the full amount in collateral. Speculators flipped paper, not railways, the same way pod shop bros trade stocks not invest in companies.
Then the capital calls came due.
As construction progressed, similar to private equity mechanics, the company called the balance. Any investor who couldn’t pay was then forced to sell, and not just the scrip, whatever else he owned, to raise cash. One failed call became another’s margin call became a banker’s liquidity crisis. The deposit buyer was a speculative unit whose gains could cover him, until the call turned him into a Ponzi unit who needed fresh capital just to hold what he had. The structure manufactured leverage by design, then converted any price decline into forced deleveraging automatically. Kinetic Deleveraging.
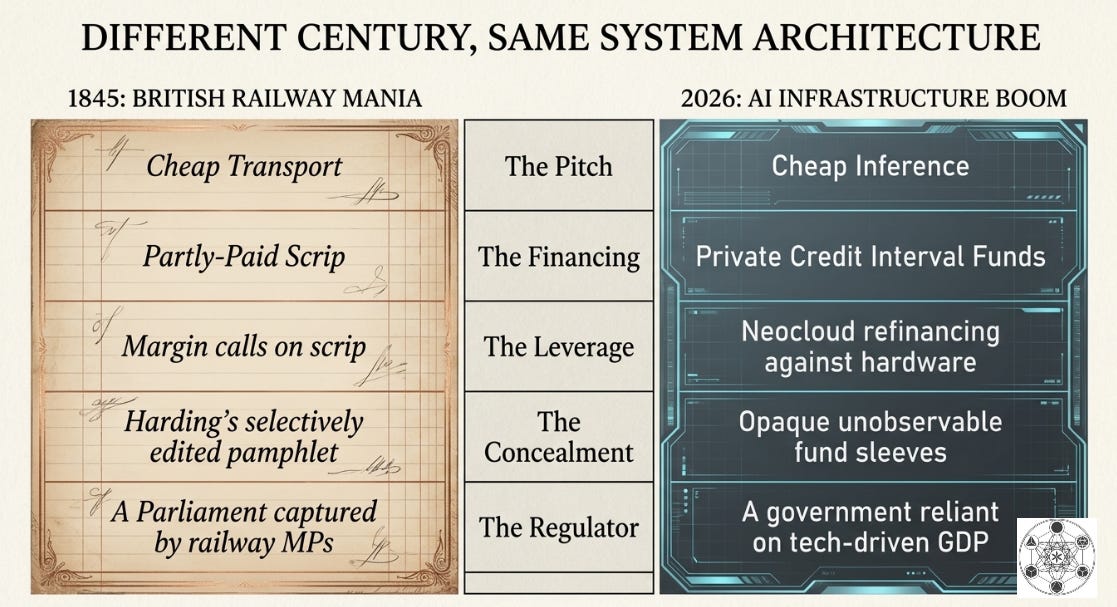
Victorian investors of the day thought that they had bought shares. Instead what they signed was an amortization schedule. The deposit was the teaser rate. The calls were the reset.
Sounds a bit like the ARMs that reset their mortgage rates two decades ago doesn’t it?
Now lets put that scrip-holder next to CoreWeave in 2026. Debt exceeding $25 billion, plus $10 billion of on-balance-sheet leases and $46 billion of off-balance-sheet commitments that grow every quarter, against collateral, GPUs, that generated $8.3 billion over the last twelve months. GPUs depreciate faster than almost any industrial asset ever financed at scale. The neocloud bought the hardware with borrowed money, secured the debt against the hardware, and assumed it would hold value and keep earning long enough to service the loans. A textbook Ponzi unit, dependent on capital markets to keep a non-economic operation funded. The 1840s scrip holder facing a call and the 2026 neocloud facing a maturity against depreciated collateral are the same structure, 180 years apart.
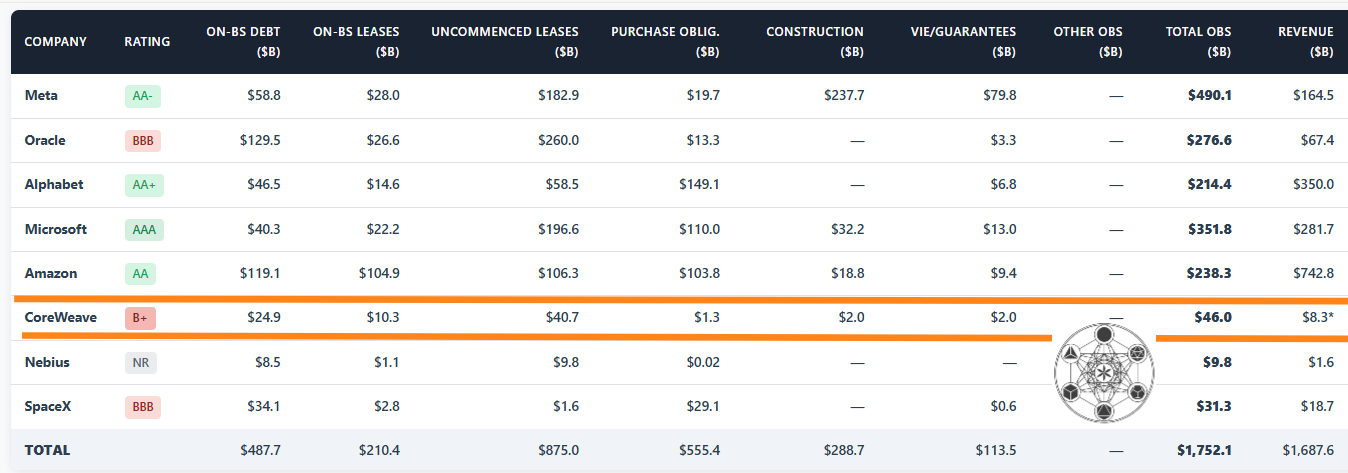
Hudson’s dividends-from-capital did the job Law’s printed livres did a century before, namely it manufactured the return that pulled in the next wave of capital. The dividend was real the way Nvidia’s revenue from CoreWeave is real, a customer Nvidia seeded, backstopped at IPO, and helped refinance. The cash moves, the transaction clears, but it came from inside the structure, not from an outside customer paying more than all-in cost.
William Deloitte performed one of the first independent railway audits, at the Great Western, only in 1849, well after the Mania had peaked. No GAAP, no SEC, no earnings call. Hudson’s word was the audit.
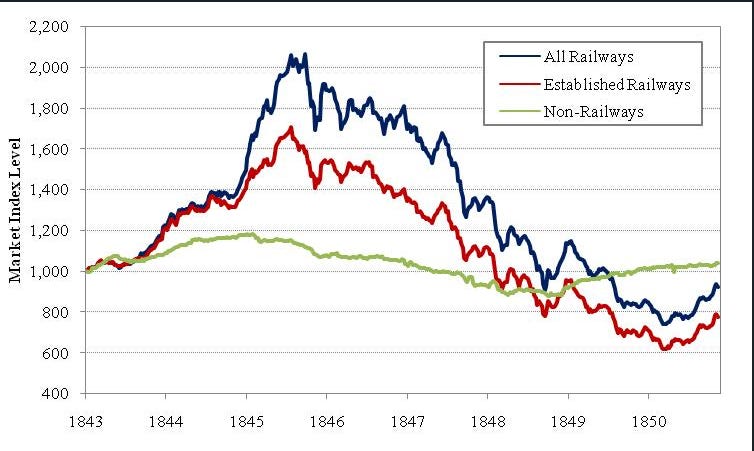
Look at the three groups. The non-railway market barely noticed, up a little, down a little, flat over the decade. The destruction was surgically concentrated in the sector doing the capex. And here’s what should bother anyone hiding in “quality stocks” today - the Established Railways, the profitable incumbents paying real dividends, akin to the Mag 7 of 1845, peaked lower than the speculative names but still round-tripped below their starting point and stayed there. You didn’t have to own the junk to lose. You just had to own the theme.
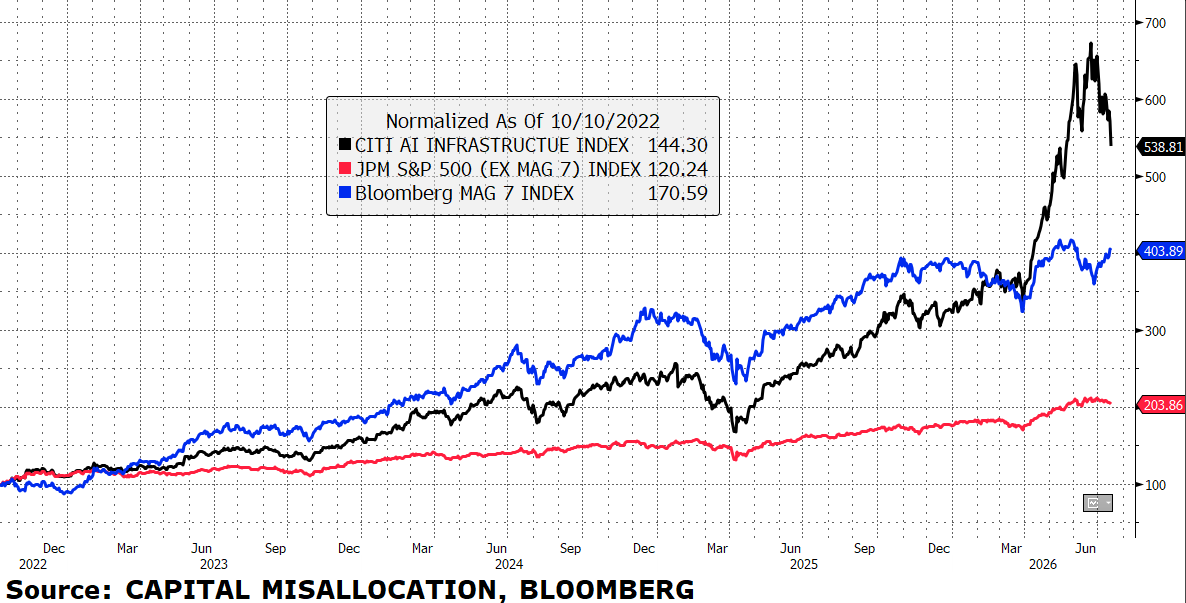
Translate all three lines into 2026: AI Infrastructure is All Railways, the Mag 7 is Established Railways, the S&P ex-Mag 7 is the Non-Railways control. Since late 2022, infrastructure is up nearly six-fold, the Mag 7 roughly three-fold, and the rest of the market is up about two-fold. One line tells a different story than 1845: the Mag 7 is still winning. So was its Victorian counterpart in year three, before it finished 1850 below where it started.
The real question is whether Campbell’s red line is a forecast or just a historical fact. Take a look who was in the winning basket - it was also the vendors of the infrastructure, not the buyers. The same transfer from capex spenders to capex receivers that shows up in the hyperscalers underperformance since September 2025, which hilariously got some folks to start referring to them as The Lag 7.
By 1848, railway shares had swallowed 63-71% of UK market value. The AI “Big Ten” peaked near 39%, the Mag 7 sits near 33% of the S&P 500, both around the ~40% peak of past bubbles, both dwarfed by the Railway Mania, which stands in its own class of market concentration.
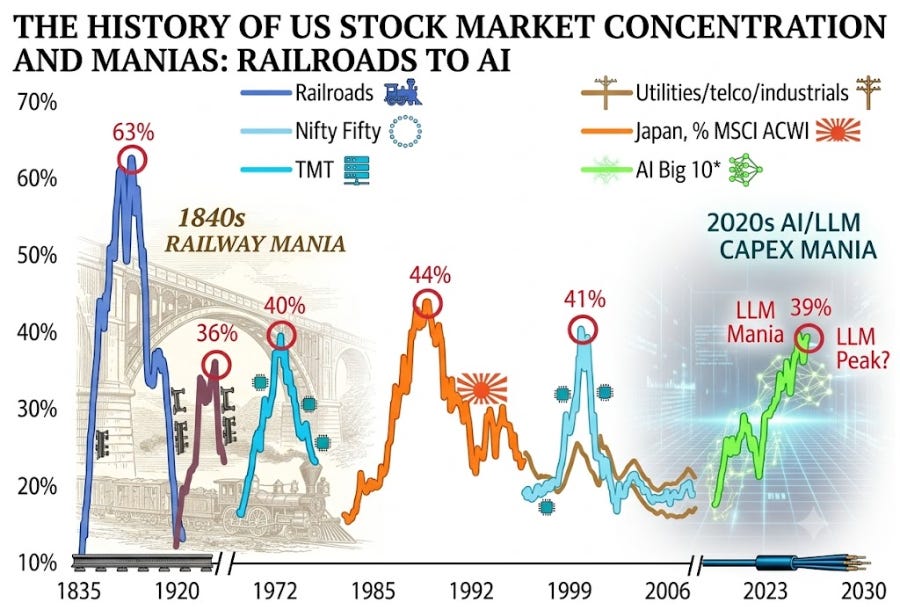
The AI boom drove an estimated 39% of incremental US GDP growth in 2025 according to the St. Louis Fed. As someone who runs a long-vol fund and is cynical on the US economy, I’ll admit the magnitude of this capex boom is what I missed over the last two years. It’s singlehandedly holding up the market and the economy to the point that it is even driving banks recent strength and leaving me to ponder “is it all one big trade?”.
That makes it systemically important in a way that creates political support as no administration breaks a capex cycle carrying the economy. The Trump administration is already floating a stake in OpenAI because Bessent knows the dominoes can fall quick when a key foundation is removed or even if there is material narrative decay.
First, we have to acknowledge that modern policymakers are prolific inside traders as The Foreign Policy Journal recent report highlighted that 56% of trades by politicians were beneficiaries of bills they were about to vote on and we have all seen the stories about the insider trading surrounding the Chief Grifter - President Trump. Second, it seems very unlikely that politicians will intentionally slow down the capex buildout that props up the growth that keeps them in office.
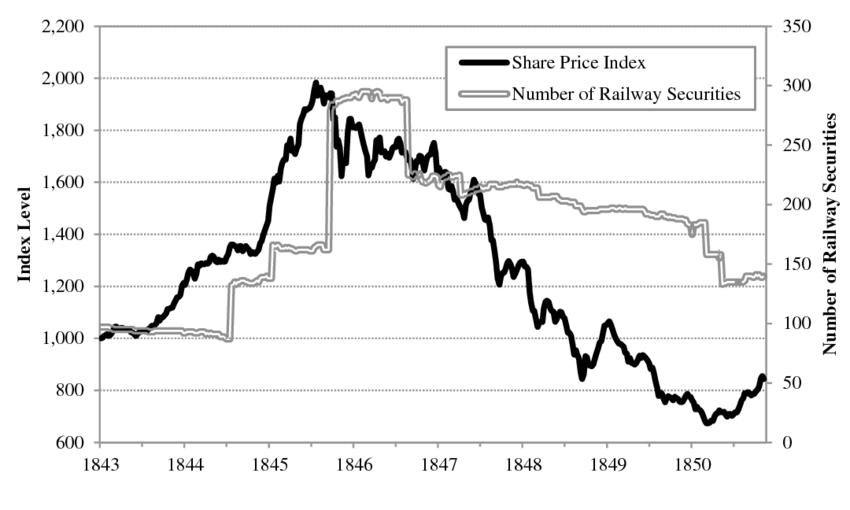
It is estimated that about a third of the authorized lines were never built and of the 221 railway companies listed in 1845 only 60 survived to 1850 - a -73% culling. The listing count tells you when the smart money sells: securities tripled in eighteen months, and the biggest wave of new paper hit at the exact top. Supply shows up when belief peaks, ask anyone who bought a 2021 SPAC or is being offered a 2026 neocloud IPO. This is the exact point that The Squirrel and I were harping about constantly in our pieces on the Space X IPO as well in numerous of our Unmissable Sunday Show podcasts like the one below.
One other thing to note is that between 1846 and 1850, Parliament passed the Abandonment Acts, letting companies walk away from lines they had been authorized to build. When the regulator legislates permission to quit, the incentive structure has already inverted. The live signal: the first hyperscaler whose stock rises on a capex cut is the modern Abandonment Act. We may have just seen this moment when META’s shares rallied on news it is considering entering the cloud business. It should be noted that since September 2025 the market has been punishing hyperscalers on incremental capex annoncements and now is rewarding monetization of existing capex.
When the market rewards not-building, the regime has flipped.
ACT THREE, PART I: THE COLLECTIVE HALLUCINATION

In “Collective Hallucinations and Inefficient Markets” (2010), Odlyzko argued that 1840s railway investors had the data required to avoid the disaster. But the danger was subtler than ignorance. His companion paper showed that the 1830s Railway Mania, about half the size of its successor, genuinely worked and delivered above-market returns. The argument goes that the prior success was the subsequent poison. Once the 1830s proved the skeptics wrong, investors grew overconfident and were immunized against skepticism (step 1 of endogenous Minsky process) and the demand models that had roughly worked got extrapolated onto every line proposed in the 1840s.
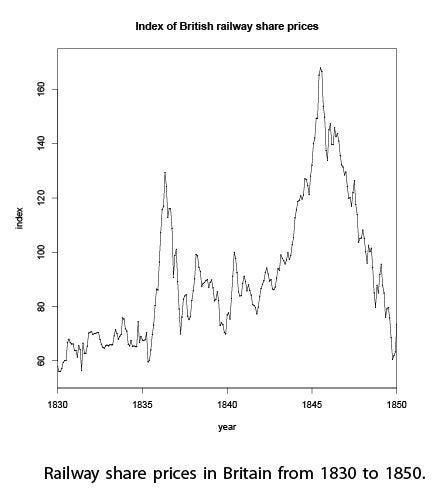
You can see the trap in the chart above. The 1836 hump corrected a third and recovered, minting the lesson that railway dips were meant to be bought - BTFD isn’t new. The correction of the peak in the 1840s took the index below where it started in 1830. Two decades of railway investing did a full round trip, and the investors who had learned the first mania’s lesson rode the second one to the bottom.
The structure can be mapped onto our current situation. The first AI wave, the deep-learning buildout culminating in ChatGPT, was a real success with genuine product-market fit. That success is what licenses the post-2023 over-extrapolation: that scaling continues forever and every incremental $100 billion of capex yields proportional revenue. The second wave is dangerous precisely because the first was real.
Odlyzko’s method was simple. Railway revenue and mileage were both public. Divide one by the other, revenue per mile, and any literate investor could see what the promoters worked to hide. Any analyst with any mettle knows that truth can be found in unit economics analysis.
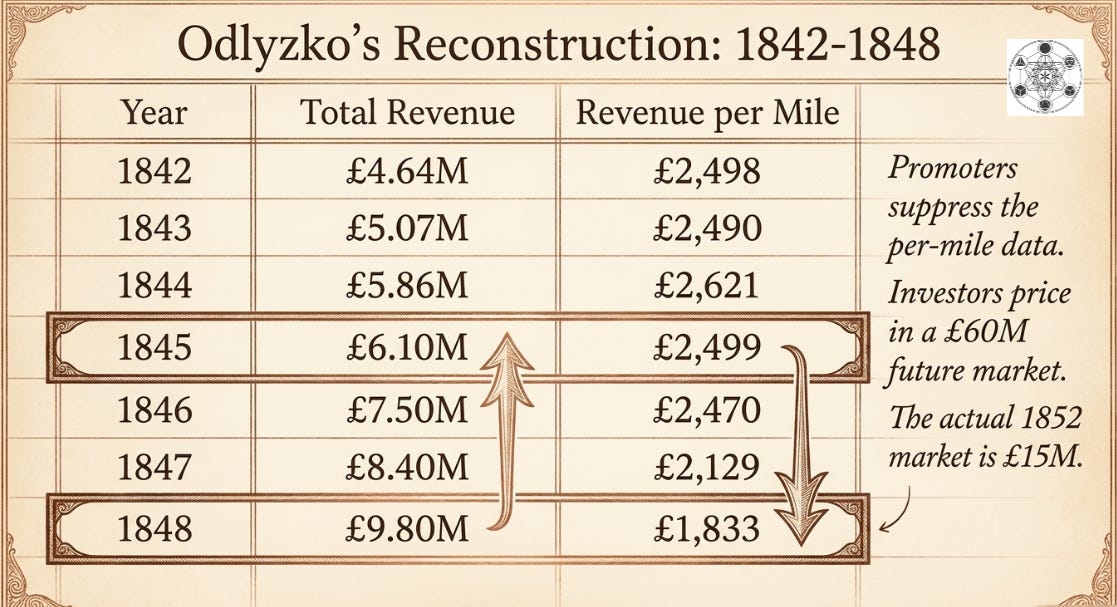
Read the last column top to bottom. Revenue per mile peaked at £2,499 in 1845 and fell 27% to £1,833 by 1848, even as mileage more than doubled and aggregate revenue kept climbing. The promoters trumpeted the aggregate and buried the per-unit reality.
Odlyzko caught one concealment red-handed - a widely circulated paper by a man named Harding gave revenue per mile, by his own reckoning, for exactly two years: 1842 (£2,489) and 1847 (£2,596), two points that alone show the metric rising. Harding suppressed every year between as the suppressed years held the peak and the rollover. Odlyzko said it “can only be ascribed to an intention to conceal unpleasant truth.” Every earnings call where a hyperscaler quotes aggregate capex or aggregate cloud growth, without touching AI revenue per token is running Harding’s playbook. This episode’s promoters are named Jensen, Satya, Mark, Andy, Intrator, and Larry.
The actual Atomic Unit of AI ROI is the task not the token as I discussed in the formal framework I have built out in last Sunday’s podcast AI ROI is Broken. I will save that discussion for a future paper but thought I would at least acknowledge it here and do a little shameless promotion.
The deeper concealment was depreciation. Bryer modeled what railways should have charged against what they actually did in practice. In 1845 they charged £0.046 million against a required £0.526 million; in 1846, £0.005 million against £0.690 million.
Honest depreciation from 1838 to 1855 would have cut distributable profit by 31%.
A Great Eastern director admitted in 1867 that they only charged only running costs, laid nothing by, and now “the rails are worn out, the sleepers are wearing out, and they will have to be renewed.” That script was written in 1845. Michael Burry is running the reprise today highlighting how hyperscalers are stretching GPU lives from a 2-3 year competitive cycle to 5-6 book years, understating depreciation by an estimated $176 billion across 2026-2028. The Victorian Gap was 31% of profits. Burry’s estimate is north of 20% at some firms.
Same tactic, same arithmetic, different century.
Which is why the cheapness is the trap, not the margin of safety. The AI bulls all reference how “cheap” the market is based on current earnings multiples. Without arguing about valuation multiples, I would add that anyone who understands the Kalecki Profit Equation knows that capex booms result in earnings booms strictly as an identity on an accounting basis. This is because the investment capex is capitalized but the revenues it produces are 100% realized - the difference results in the upward earnings revisions we have seen during this expansion.
Railway shares in 1845 didn’t look expensive. They yielded 7-10%, and the yield was the tell in this case because the yield was Hudson’s arithmetic, paid from capital, not income. The Mag 7 trades near 25x times trailing earnings today, comfortably below dot-com levels, which is exactly why it feels safe. Strip out the depreciation Burry says is missing and the revenue that just recycles through Nvidia, and the real multiple sits in the mid-30s. Cheap on numbers that aren’t real is the most expensive thing you can own. And lets not even get started on those arguing memory stocks or other infrastructure beneficiaries are cheap on NTM P/E multiples. It’s almost as if there is a legion of investors who have never spent the time to understand how cyclicals trade - i.e. they are the most expensive when their multiple appears to be the cheapest.
Odlyzko’s verdict on the information being available but not used is akin to the idea that investors were implicitly cramming “between 150,000 and 300,000 people into a ballpark built for 50,000.” Railway revenue was £6 million in 1845; investors priced in £60 million by 1852. The actual realized figure ended up being £15 million. OpenAI and Anthropic are both targeting 10x revenue growth by 2030.
One man saw the situation clearly back then and his name was Robert Lucas Nash; we can think of this gentleman as that period’s Michael Burry or Ed Zitron. Nash compiled by hand his “Dissections of Railway Accounts” from 1847 to 1848, which included 40 columns of capital raised, capital spent, cost per mile, revenue per mile, and coined the distinction between “honest” and “dishonest” dividends - differentiating those paid with profits versus capital. Contemporaries credited him with triggering the crash and his work helped invent the field of financial securities analysis.
But here’s the caveat Odlyzko insists on, and I’ll give it the respect I gave Garber in The South Sea Machine.
“The great final railway share price crash would have happened even if Nash and Smith had been silent, and Hudson’s operations had been squeaky clean.”
~ Andrew Odlyzko
The Capital Deployed Could Not Earn Its Cost of Capital.
That sentence is the one thing I want readers to take away from this essay.
The whistleblower exposed the rot but it was the fundamentals that caused the crash. Honest books wouldn’t have saved the railway investor, and a squeaky-clean Hudson wouldn’t have either, because the problem was never dishonesty. It was overcapacity meeting a demand curve that arrived slower than the capital expected.
ACT THREE, PART II: THE MODERN HALLUCINATION
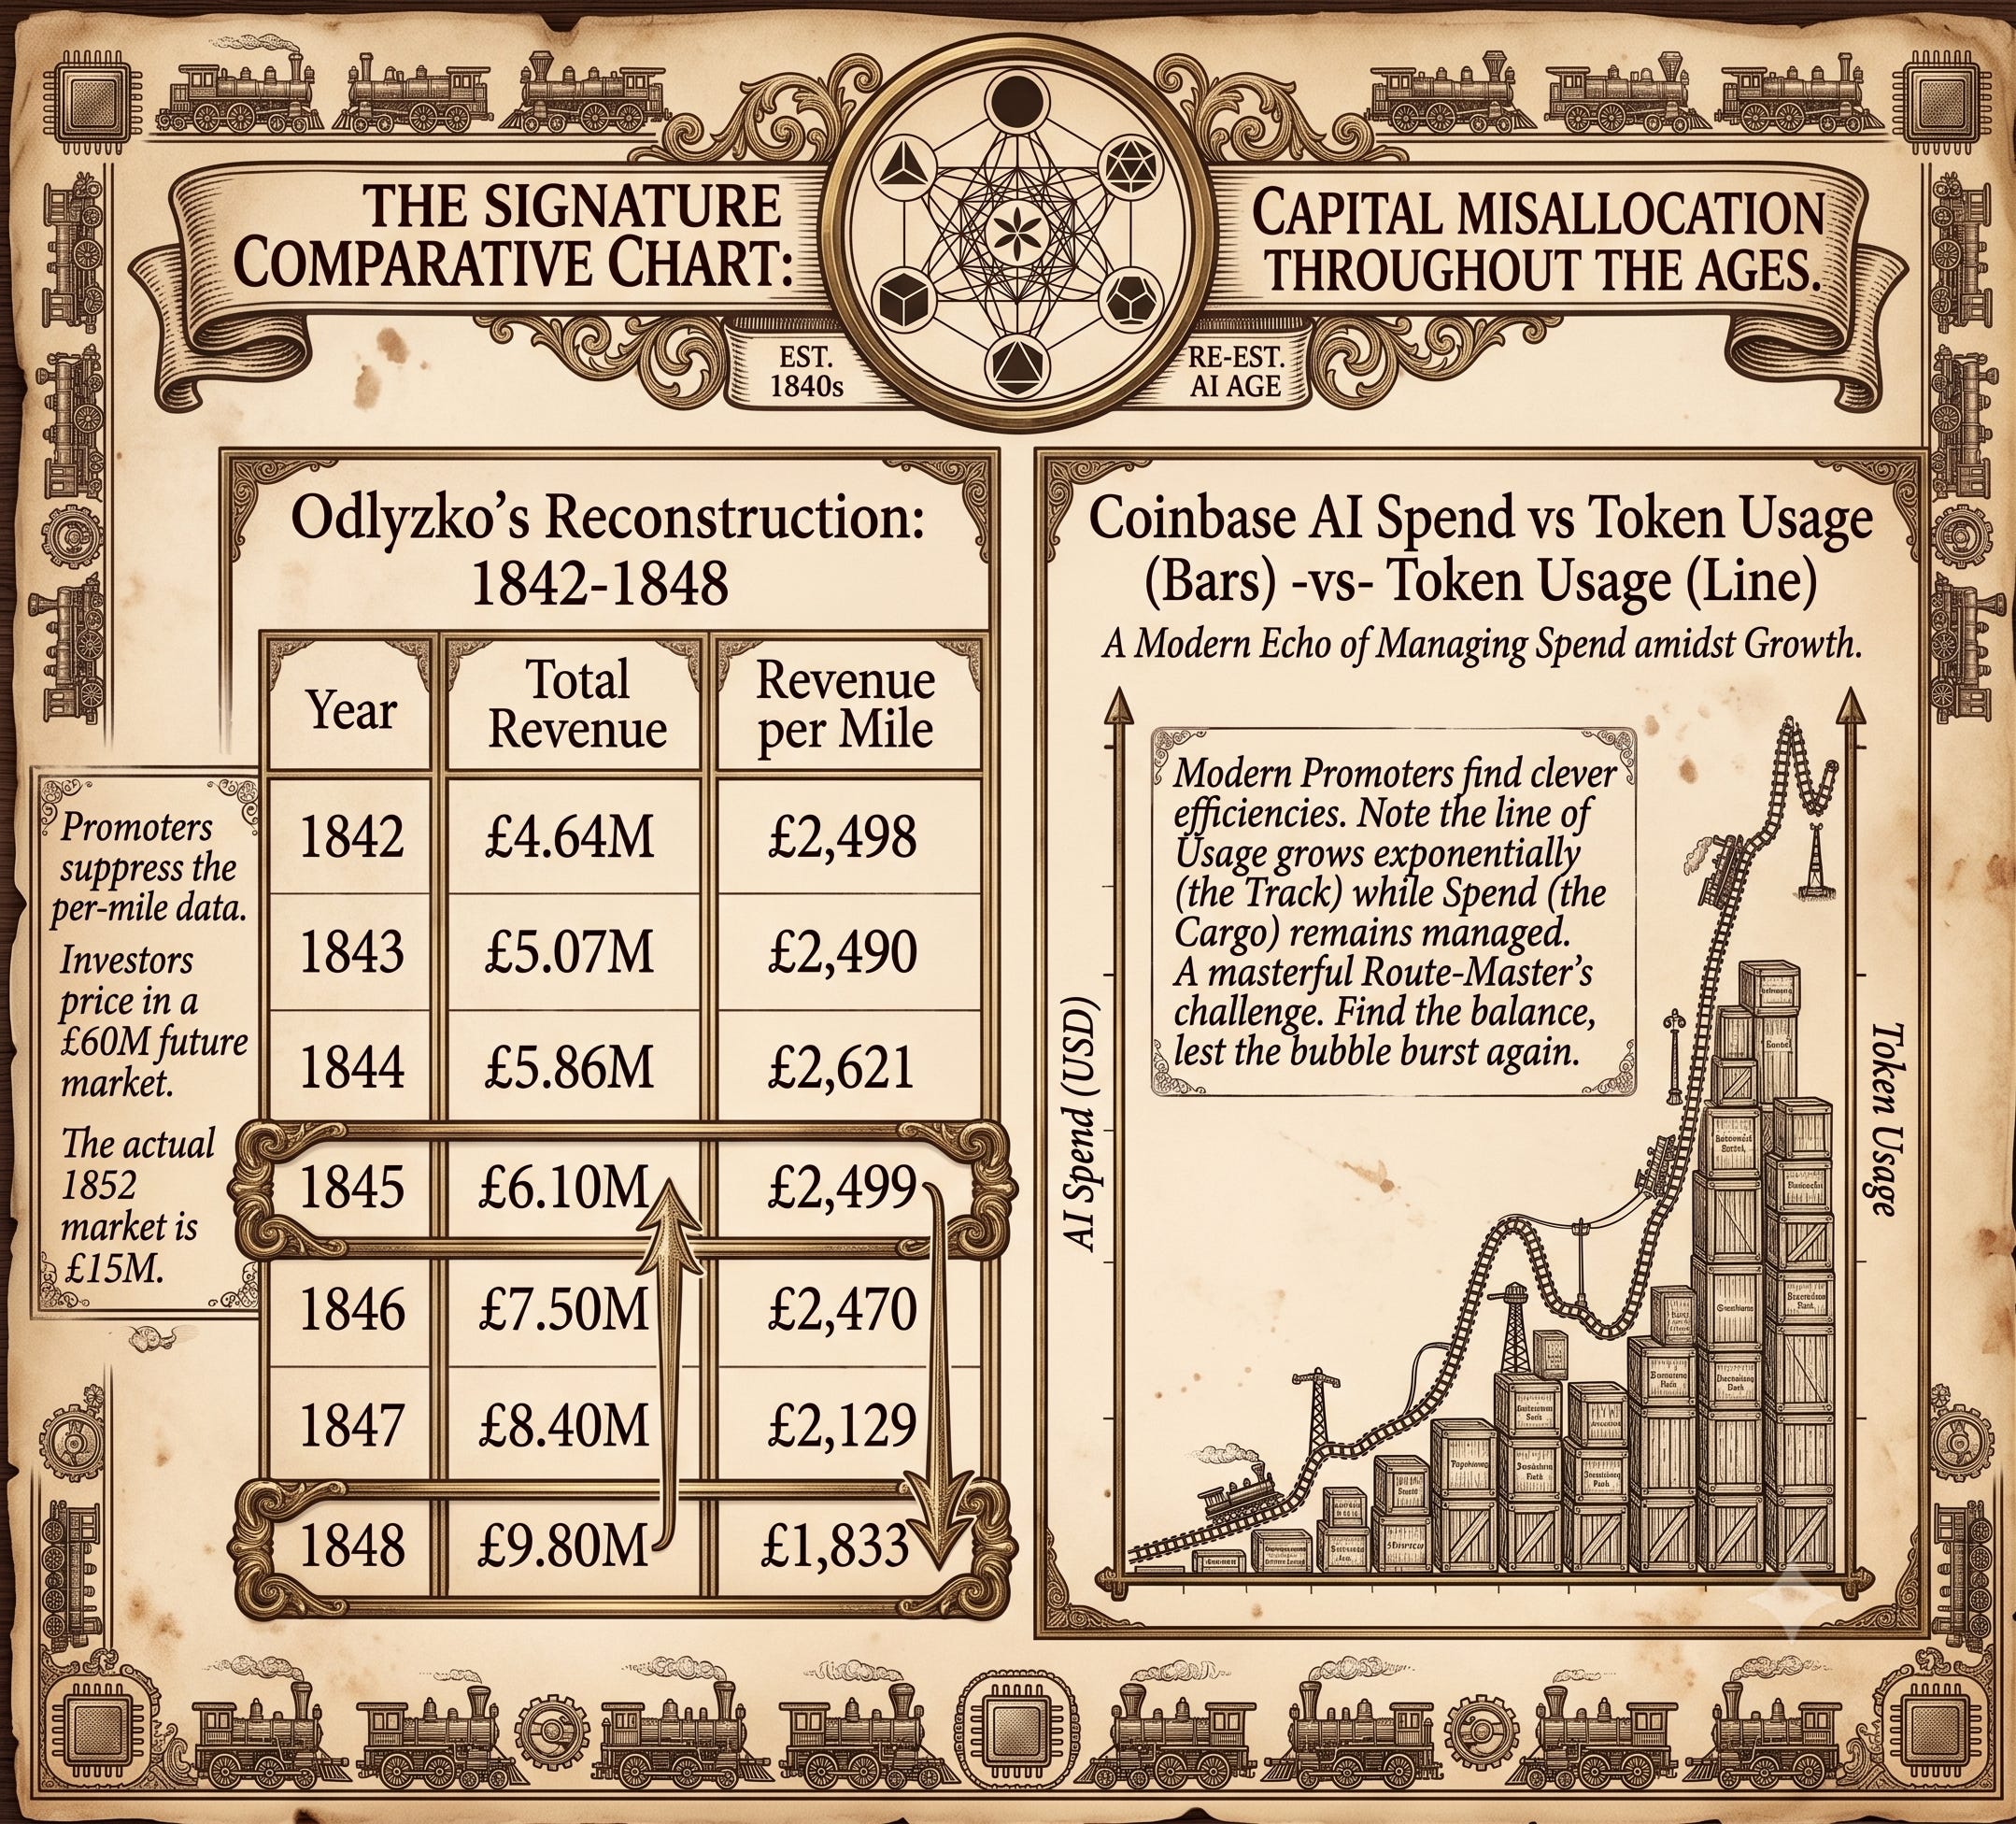
Now the same arithmetic in real time, with a twist that makes it worse.
Two weeks ago, Coinbase CEO Brian Armstrong published a Tweet on X featuring a chart of his company’s AI spend against its token usage. The chart His message was triumphant - total AI spend is down despite token consumption continuing its vertical rise.
“Putting this into practice has cut our AI spend nearly in half, while our token usage continues to grow.”
~ Brian Armstrong, CEO of Coinbase
He walked through the playbook I’ve been hammering on about lately on social media. They default to open-weight models like GLM 5.2 and Kimi 2.7 through a central gateway, route to the cheapest model that can do the job, optimize prompts and cache hits, keep context lean. He framed it as engineering excellence. He’s right. Intelligent use of LLM’s requires users to define successful outcomes, design measurement into the process, utilize optimized routing and prompts/skills, account for the trade off between quality and cost, not lean on counterfactuals, utilize a governance layer, and build out the upper stack that includes a memory layer as LLM’s achilles heel is context.
But Armstrong was unknowingly channeling Robert Nash, publishing the 1840s revenue-per-mile chart, rotated into 2026 and rebranded as a strategy. In 1845 the asymmetry ran one way and suppliers hid the per-unit decline from investors. In 2026 it runs the other way. The customers publish it proudly, as best practice, because they’re the beneficiaries. Token consumption follows a brutal power law where 1% of users consume over half the tokens, and that 1% is the sharpest cohort on earth of users and they simply won’t overpay unless someone else foots the bill. When Uber’s COO said they’d blown their entire 2026 token budget in 3-4 months after the labs moved everyone to volume pricing, the cat left the bag. Since then the drums of disappointing AI ROI have only started to beat louder and louder in the marketplace.
Read the direction of Armstrong’s chart. Spend falling while consumption keeps climbing means revenue per token collapsed inside a single optimization cycle. That’s the modern £2,499 to £1,833, except compressed into months, at one company. Multiply across global enterprise and you have the demand problem that $725 billion of capex this year alone was not built to absorb. The concealment being gone doesn’t change the arithmetic. It just means the people building a trillion dollars of infrastructure are watching customers optimize the revenue away in public, and building anyway.
The macro backs the anecdote. Altman says enterprise customers now ask “not for smarter models, but for more efficient ones.” Inference for a GPT-4-class query has fallen more than 90% in under two years. Bain sized the gap at industrial scale: the industry needs $2 trillion in new revenue by 2030 to justify the capex, and even after AI-driven savings, the world is still $800 billion short. MIT’s Project NANDA found 95% of enterprise AI pilots delivered no measurable P&L impact. Brynjolfsson’s J-curve explains why: output drops first while firms rebuild processes and data pipelines, so the returns are real but delayed, which is more damning for a capex schedule sized to immediate payoff, not less.
Bulls will argue that the increased token consumption as token prices collapse will yield aggregate total growth and follow Jevons Paradox until their faces turn blue. They are referencing William Jevons observation in 1865 that Britain began to burn more coal as steam engines became more coal-efficient. The one thing the bulls always tend to leave out is that coal consumption’s exponential growth pattern transitioned from exponential to linear growth that eventually flat-lined and ultimately declined. There are four distinct ceilings that constrain Jevons S-Curve that I highlight below - Human Bandwidth, Thermodynamic Ceiling, Technological Substitution, and Demand Saturation. Bulls today truly believe that it will run expoential until it hits the Demand Saturation Ceiling meaning that its share of the global economy only can reach a certain market share until it converges with long term economic growth drivers.
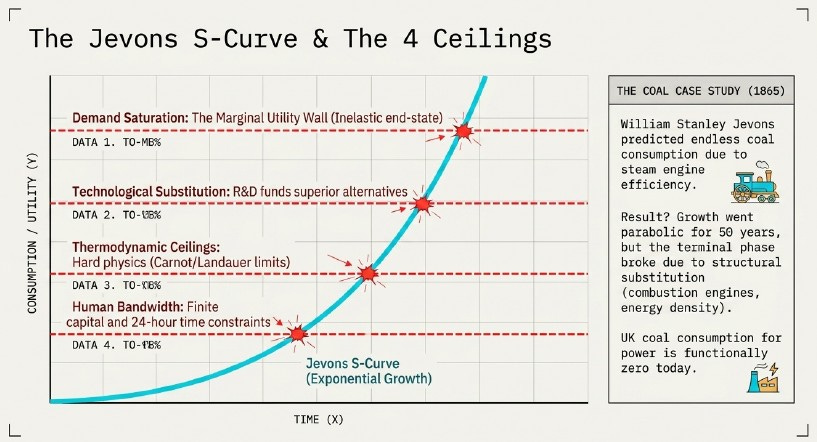
The arithmetic hasn’t changed in 180 years. We’ve just rebranded the problem as the solution.
ACT FOUR: THE MODERN MACHINE
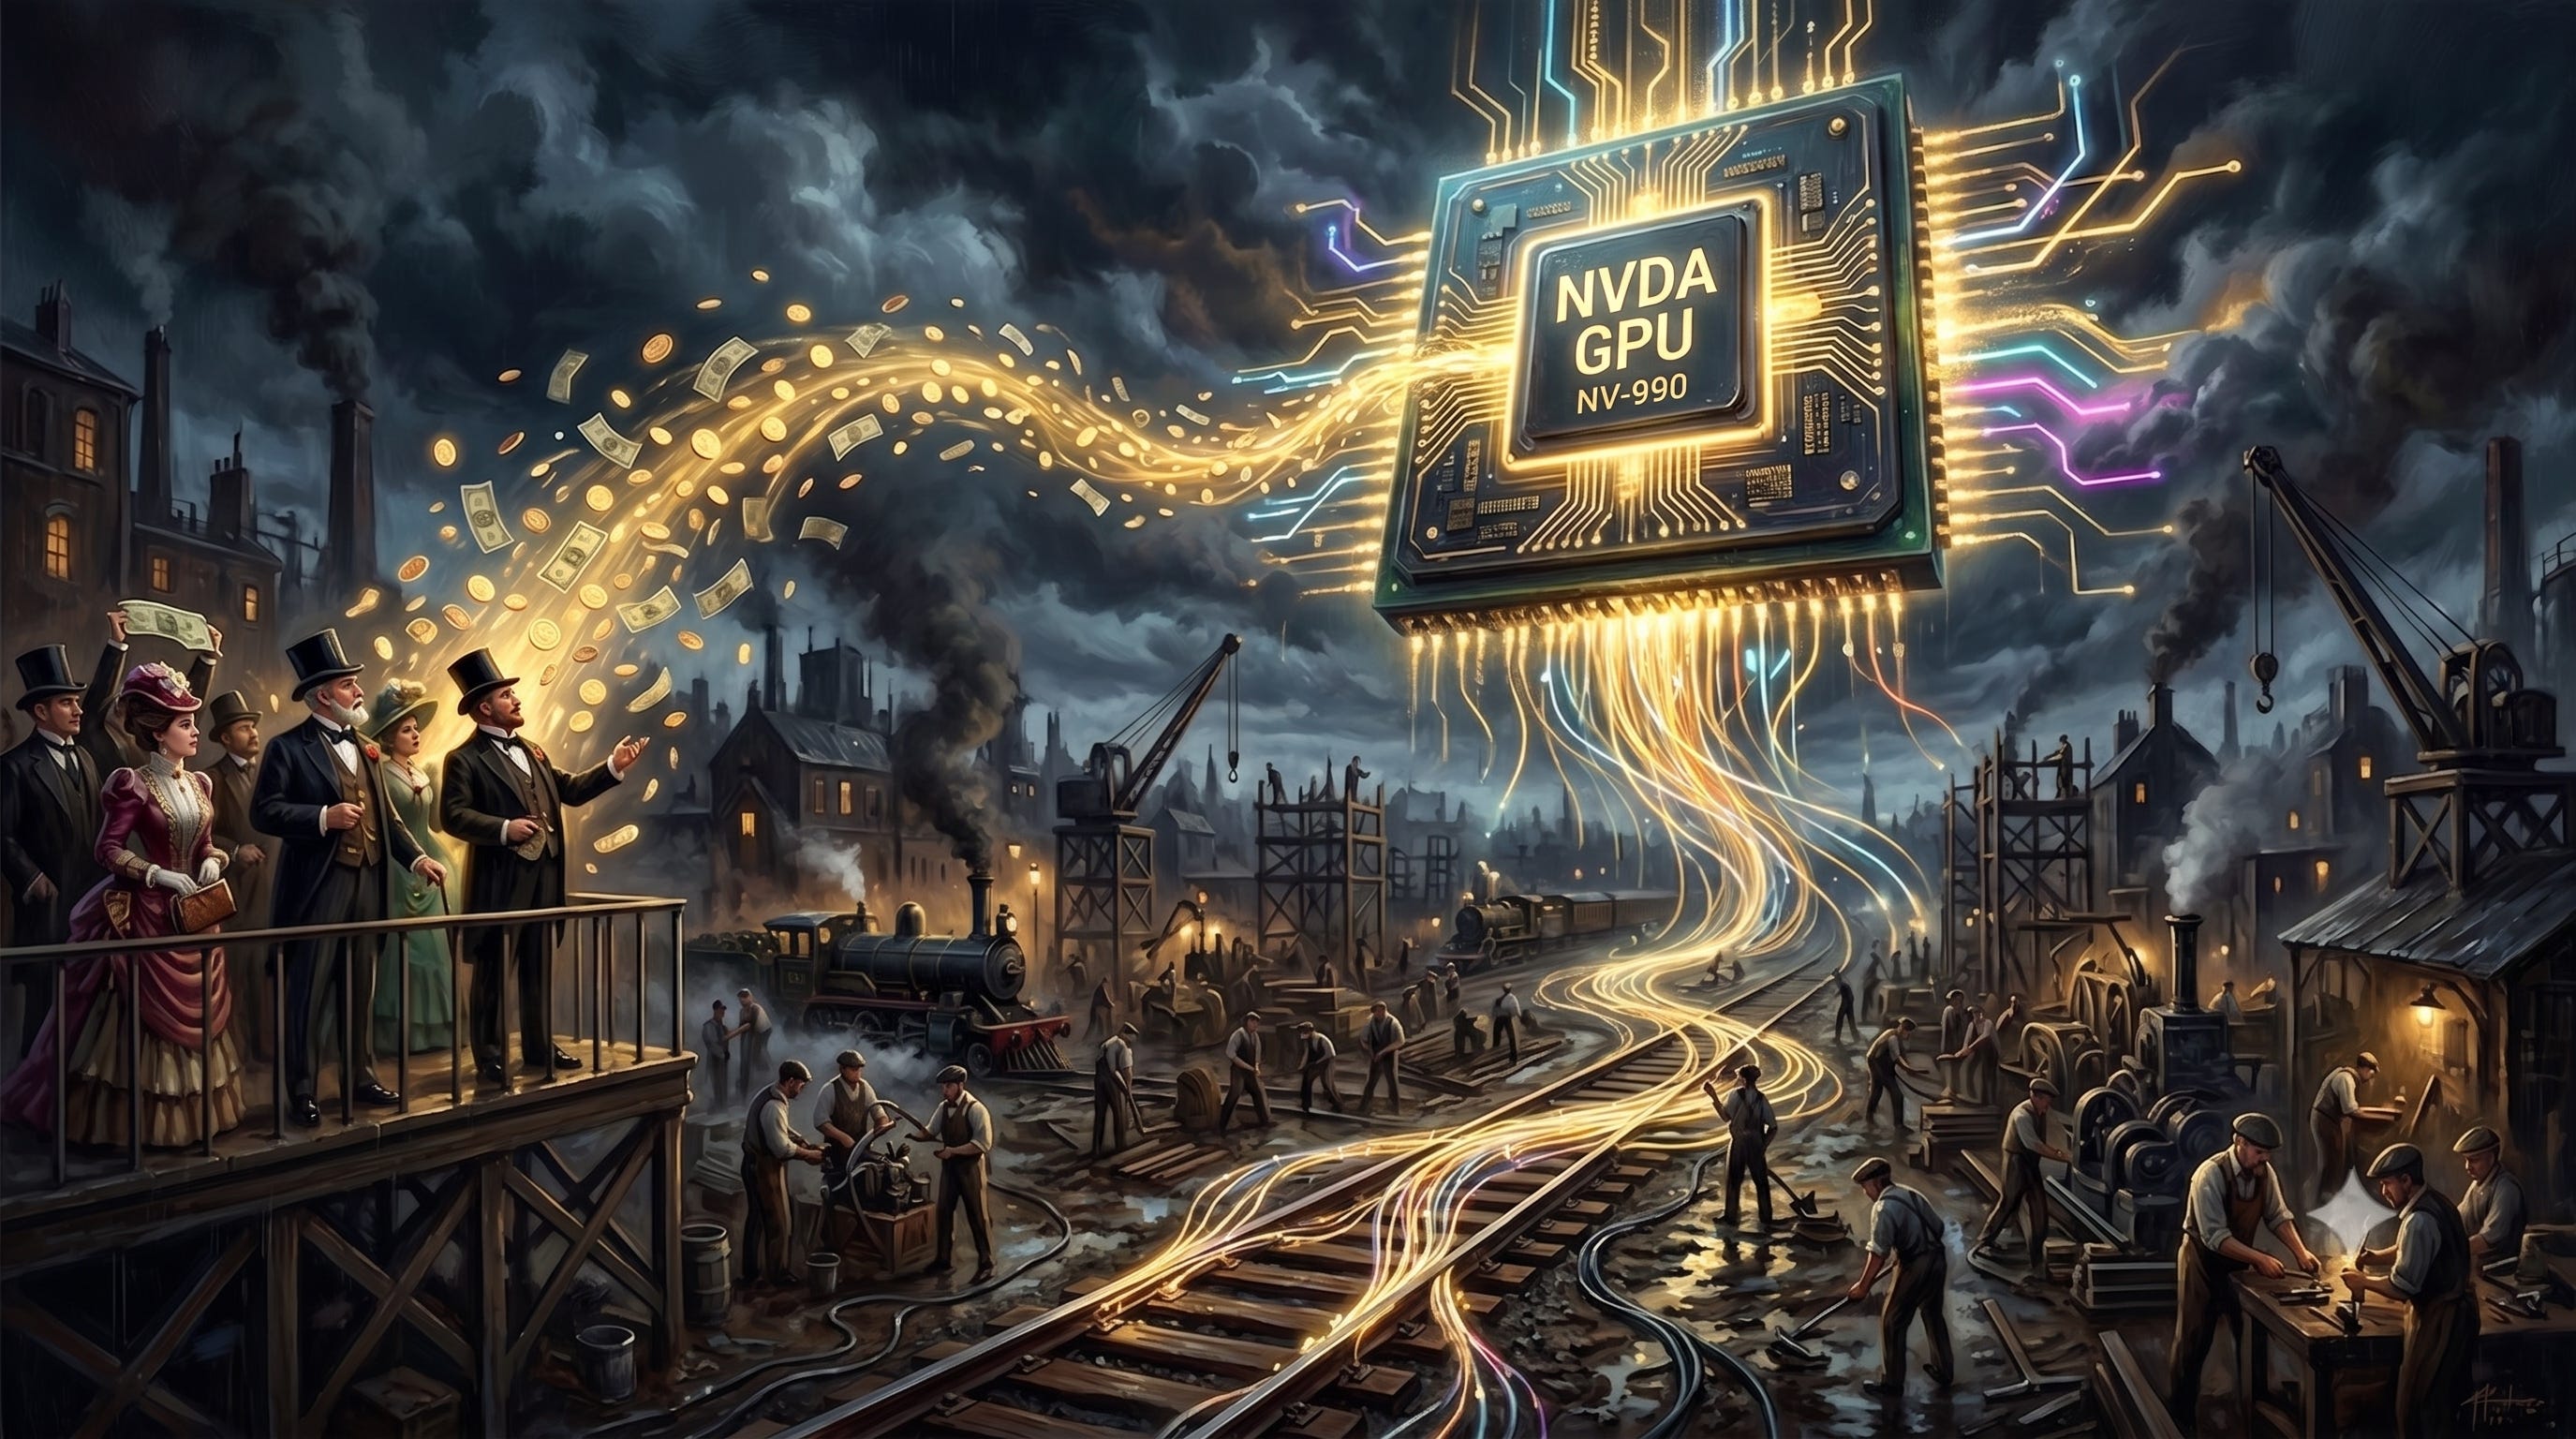
As I write in early July 2026, the buildout is accelerating, not decelerating, but definitely is beginning to see growing skepticism given the Lag 7 underperformance and recent moves by Space X and Meta to enter the cloud space along with a pretty sharp drawdown in the Picks and Shovels stocks recently. The machine now manufactures the yield signal through three channels at once. Stretched depreciation makes reported earnings too high (Burry’s $176 billion). Circular revenue books the same dollar twice as it loops Nvidia to CoreWeave and also drives Google’s EPS up via equity method accounting on its Anthropic investment. Vendor financing is basically capital-funded commitments getting rebranded as demand. Hudson ran one channel - the fabricated dividend. The modern complex runs all three, and each one independently makes the stock look cheaper than it is in reality
Together they manufacture a valuation floor that isn’t there.
I laid out the circular financing machine in The New Mississippi. Nvidia investing in the customers that buy its chips, hyperscalers funding startups that recycle the investment into cloud commitments, Elon’s intra-empire loops. The plumbing hasn’t changed but the pressure has significantly. The last few months moved the story from structurally fragile to visibly straining.
Start with scale, in 1847 terms. Britain put £44 million into railways in one year, 7-8% of GDP, twice the military budget. In 2026 the five largest US hyperscalers guide to ~$725 billion in combined capex with Goldman now estimating $800 billion, up from $410 billion in 2025. Goldman also projects past $1 trillion in 2027 and an eye watering $7.6 trillion cumulative by 2031. Capital intensity now runs 45-60% of revenue, which makes these firms more like utilities vs how they have been tradtionally viewed as asset-light tech companies. No surprise the UBS “Hyperscaler Index” has trailed the S&P 500 by 2145bps since September 2025 when AI capex spend stopped being rewarded by the market.
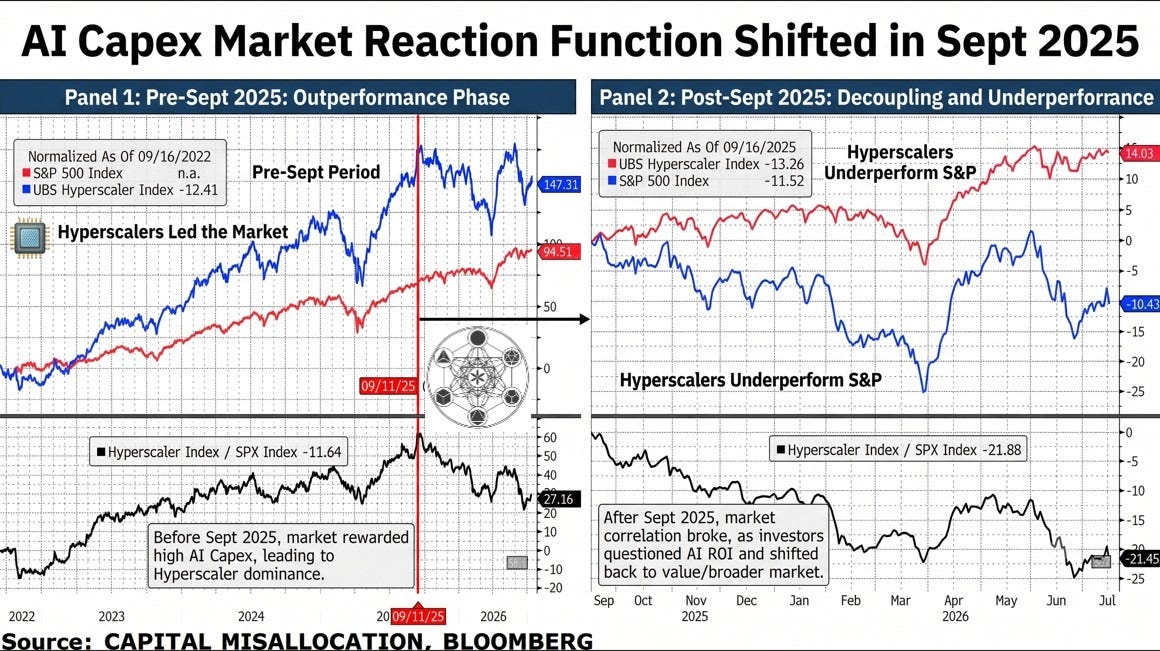
On my AI Capex Boom Monitor website that is available for paying subscribers, I created a FCF Zero Crossing Countdown Monitor and as of July 16th 2026 we are now roughly sixty days the aggregate free cash flow at the largest tech companies on earth is going negative. This means that incremental capex funding will need to be funded from the credit and equity markets as the hyperscalers have exhausted their operating cash flow. Not surprisingly they’ve started tapping debt and equity to plug the gap.
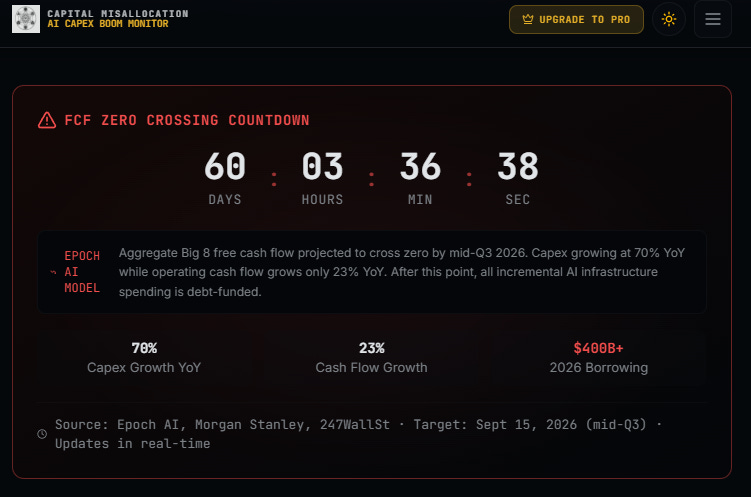
Everyone is tapping the market now. In the last six weeks we have seen Google’s third-ever equity offering (~$80 billion in June), a $20 billion Meta raise not yet placed but test ballooned in June, SpaceX issuing $100 billion in equity and $25 billion in debt in a single month, and NVDA’s $25 billion debt offering. If this capex bonanza is going to meet Wall Street estimates it will be funded by the capital markets - an increasing fragility in the story.
Two other occurences mentioned have happened in the last six weeks as well - SpaceX leased its data center to Anthropic and Google and Meta has recently announced its intention to lease compute as well. Its worth noting that META committed $35 billion to CoreWeave and $27 billion to Nebius and represents a large percentage of the two leading neoclouds business and backlog.
When the customer becomes the reseller, those contracts are the ceiling, not the floor.
The bigger tell is at the top of the food chain. In April 2026 Microsoft ended its revenue share with OpenAI. The software behemoth dropped its exclusivity and gave up its right of first refusal to supply compute, basically MSFT is keeping the equity upside and walking away from the bills. Meanwhile SoftBank is trying to raise a $10 billion margin loan against its OpenAI stake, offering a personal guarantee after lenders balked at the collateral. The best-informed counterparty is quietly shortening duration on a borrower it’s decided not to underwrite. That is the Hudson mechanic in modern dress. And like Hudson’s scrip, each round buys less credibility: OpenAI’s round-over-round step-ups have compressed from 1.8x to 1.2x across five raises. The premium is fading even as the headline valuation climbs, which is exactly what Hudson’s scrip did before it stopped trading above par.
The Credit Layer Is Already Cracking
The credit market, the adult in a room full of equity monkeys, is pricing the discomfort. Oracle’s CDS climbed from ~45bps in September 2025 to ~187bps as of today, with newer data centers pricing at SOFR +300 in the private loan market. Coreweave debuted its CDS around that time last fall and has seen its spreads widen from ~325bps to 635bps. SpaceX CDS started trading June 23rd last month at 110bps and now sit at 160bps. I could keep going as even the mega cap safer hyperscalers have all seen material spread widen since last September as well.
“There is something inherently uncomfortable as a credit investor about the transformation… that is going to require an enormous amount of capital.”
~ Daniel Sorid, Citigroup
The strain isn’t only at the hyperscalers. There’s a second layer, private credit, and it’s where the first cracks are actually showing, not in CDS spreads but in gated redemptions widening every quarter. The 1847 crisis that broke the Mania didn’t start with shares crashing. It started when the banks that financed the speculation couldn’t meet their own obligations. Private credit is the early innings of the same discovery. The Squirrel and I dug into it with Lakshmi Ganapathi of Unicus Research on a recent episode of our show.
Two mechanics, both invented in the 1840s.
First, the redemption spiral. Across the $1.8 trillion market, at least ten vehicles have reported elevated redemptions since January and at least eight have gated, not sub-scale funds, the cream of the shadow banking system. Cliffwater’s flagship went from 5.3% of NAV requested in Q4 2025 to 14% to 17%, against a 5% cap. The cap is the trap: an investor who gets a third of his money back resubmits next quarter, and pro-rata rules make requesting rational even for holders who want to stay. The queue feeds itself. It’s the capital call in reverse: instead of the fund demanding cash from investors, investors demand cash the fund doesn’t have. And roughly a quarter of what’s inside is software, the same companies whose moats AI is compressing, levered by PE sponsors at peak valuations at SOFR +500. So much for “private-market returns with public-market liquidity.”
Second, the lender-to-lender plumbing. Roughly 40% of the flagship’s net assets aren’t loans to operating companies at all. They’re claims on other lending vehicles: CLO tranches, BDC stakes, partnership interests. Its sister fund is worse, at 71%. A lender that lends to lenders. So when it sells those stakes to fund redemptions, it marks down the very funds holding loans to the same borrowers it lends to directly. One fund’s redemption problem becomes the sector’s repricing problem, single-platform exposure dressed as diversification. That’s the scrip cascade exactly. In 1845 the holder who couldn’t meet a call sold everything and the selling rippled outward. In 2026 the fund that can’t meet its queue sells its stakes in other funds, across a market where the same managers sit on every side of the table.
The data centers are real concrete and silicon. The revenue that’s supposed to justify them is, to borrow a phrase, perpetually next year.
ACT FIVE: THE BREAK IN THE ANALOGY ISN’T BULLISH

I don’t trust an argument that won’t show you where it breaks. Here’s where the railway parallel is weakest. Railway track and earthworks depreciated at 1-4% a year implying realized useful lives of 25 to 100 years. Hudson’s viaducts actually still stand; the cuttings Stephenson carved through the Pennines still carry trains. The fiber laid during the 1990s telecom boom lasted 30 years and much of the dark fiber from the dot-com bust still runs the internet’s backbone.
To reiterate, when a bubble builds durable infrastructure, the social return survives even when the private capital that funded it gets annihilated.
GPUs are most definitely not railway track nor high speed fiberoptics. Nvidia ships a new architecture every one to two years - Ampere, Hopper, Blackwell, and now Rubin. Hyperscalers book depreciation over five to six years but skeptics like Burry argue the real life is two to three, understating depreciation by ~$176 billion across 2026-2028 and overstating profits by more than 20% at some firms. He called it “one of the more common frauds of the modern era.” Nvidia rebutted hard, arguing old chips keep earning as they cascade from training to inference to batch. The argument remains unsettled as to the true useful life of a GPU and is why neoclouds’ equity trades at 80-100 implied volatility.
Taking account for facts in the market, we have seen that Amazon has already shortened part of its fleet from six years to five, citing the pace of AI development. Conversely, Meta went the other way and stretched some server lives to 5.5 years which cut $2.9 billion of 2025 depreciation. Same technology but different books and yet both were waved through. Goldman’s own sensitivity cut assumed if useful life is cut from five to three years then you add roughly $1 trillion of cumulative depreciation over 2026-2031.
So AI’s surviving infrastructure, is the power, land, data center shells, cooling systems, and fiber. Not the GPU silicon that absorbed most of the capital. The data centers will endure but the GPUs inside may be two generations obsolete before the debt that financed them matures.
The Steel-Man: Ricky Ho and the Jevons Paradox
Now the strongest bull case, because it deserves a full hearing. Ricky Ho argues the variable that decides where AI profits land isn’t intelligence but the intelligence delivered per dollar. As inference gets cheaper, enterprises don’t ration it, they embed it everywhere. Cheaper per token, more tokens, and thus he comes back to Jevons Paradox like all bulls do ultimately. His punchline is that both futures favor the owners of installed compute. If efficiency outruns demand, capex slows and free cash flow inflects up. If demand outruns efficiency, revenue grows on hardware you already own. Stop asking who sells the next GPU. Ask who owns the last one.
It’s elegant, and as mentioned above, Coinbase CEO Brian Armstrong’s data supports the demand half. Jevons is real until it stalls out as it comes up to one of the four ceilings mentioned that act like a logarithmic transformation of the exponential growth. It happened with storage, bandwidth, cloud. But it also happened with railways and that’s the problem. Promoters made this exact argument in 1845. The argument was that cheaper fares would stimulate enough traffic to more than compensate. They were directionally right, traffic exploded, and catastrophically wrong on magnitude. Revenue per mile fell 27% while total revenue merely doubled, nowhere near enough to earn a return on £250 million, and dividends sat at 2% for a generation.
Ho’s framework quietly skips the scenario that the The 1840s Railway Mania actually ran where efficiency improves, demand grows, and the capital still can’t earn its cost of capital because too much was deployed too fast against demand that arrives on a slower curve. The technology winning and the investors losing aren’t contradictory. That’s a foundational concept of Capital MisallocationTM.
One caveat. Not all compute is fungible as frontier-scale coherent clusters rent at ~3x commodity GPU-hour rates, so the losses concentrate in duplicative commodity inference, not the trunk lines. The railway analog is exact, trunk routes between major cities had wildly different economics from branch lines through thin markets, and the destruction concentrated in the branches. Conceding this tells you where the losses are likely to land this time around.
Ho’s strongest argument is the one place the analogy strains. It isn’t demand. It’s software making already-deployed hardware more productive over time. Track never improved after it was laid. GPUs do: distillation, quantization, speculative decoding, smarter routing, more useful work per watt a year later on the same chip. The cache-hit surge in Armstrong’s chart is exactly this. If it dominates, the installed base compounds instead of depreciating, and the analogy breaks at its foundation.
I’ll concede the mechanism and publicly argue that better system design, better orchestration, and adding the upper stack will all lead to massive efficiency gains. But lets watch where the surplus goes; it may end up the opposite of where the bulls want it. If existing hardware keeps getting more productive through software, the incentive to buy the next generation GPU actually declines. Why buy Rubin at a premium when an update makes your Blackwell fleet 40% more efficient for free? The beneficiary is the asset owner, not the asset seller, and the asset seller, Nvidia, is the name carrying the entire circular loop on its revenue line. Edward Chancellor’s capital cycle predicts this precisely - capital floods in, builds overcapacity, returns compress for the builders and suppliers even as the users capture the surplus. Ho’s strongest argument, followed to its end, isn’t a refutation of the misallocation thesis. It’s a description of who ends up holding it.
CMSS: British Railway Mania vs AI Investment Boom
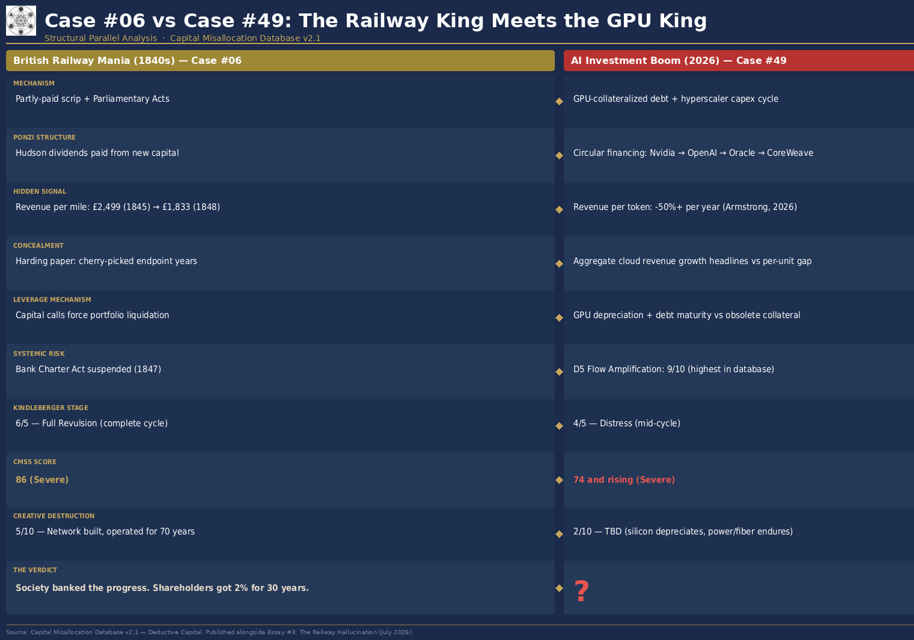
The Railway Mania’s scrip/capital-call structure was a mechanical, price-insensitive forced-selling amplifier lead to the railway market crash. And the crash fed the Commercial Crisis of 1847, which forced the Bank of England to suspend the Bank Charter Act, a genuine systemic banking event. Those dimensions along with the other more obvious parts lead to the 1840s Railway Mania registering a score of 86, not far off the Dot-Com’s 96 CMSS score.
The AI Boom scores 74 currently and I think the gap is defensible. George Hudson did in fact commit fraud whereas AI’s circular financing is mostly legal. The railway capital came from dispersed retail savers whereas AI is funded substantially by the strongest balance sheets on earth that yield serious cash flows. The Mag 7 earnings represent ~30% of aggregate S&P 500 earnings, unlike 1845’s promoters.
But look at Flow Amplification (D5) and we see that the AI Boom scores 9/10, which is the single highest reading in all 56 cases, above the Dot-Com and above the GFC. That score of 9 is due to the passive-flow machinery detailed in The South Sea Machine - the Gabaix-Koijen 5-to-8x price-impact multiplier, index-inclusion forced buying, the concentration that turns every 401(k) into a leveraged bet on this one cycle earning its cost of capital. The Railway Mania scored a 4 on this dimension making it a real factor but with a fraction of the magnitude of today’s situation. This is likely mostly due to the fact that there were no index funds in 1845. If there had been then you better believe that the crash would have been far worse. The composite measures how bad the misallocation was using the benefit of hindsight. Flow Amplification (D5) measures how fast the exit clears. On that measure, the AI Boom is the most dangerous case I’ve catalogued in this database.
A second flag, without moving the number yet. The AI Boom’s D6 sits at a score of 6. The lender-to-lender cascades, the $1.8 trillion market with eight vehicles gated in two quarters, a JPMorgan synthetic risk transfer signaling a G-SIB offloading first-loss risk on its own private-credit book, all push on that 6. The ECB puts euro-area insurer exposure to private credit at ~€211 billion; US life insurers hold $849 billion in private placements, up from $386 billion in 2014. If the software loan book starts cascading, D6 goes to 7 and the composite with it. We will keep an eye out to see if it moves as the data changes as we progress through the current situation.
One last thing the table encodes. The Railway Mania sits at Full Revulsion; it ran the entire Kindleberger cycle to the bottom. The AI Boom sits at Distress. Currently we sit somewhere in the middle to early late innings of this cycle. This is time in the cycle where the credit market clears its throat and the first cracks show in the concrete.
The question was never whether the cycle completes. It’s when.
ACT SIX: THE CAPITAL CYCLE

Edward Chancellor, whose Devil Take the Hindmost and Capital Returns are two of the definitive modern treatments of speculation, noted the 1840s promoters “implicitly assumed passenger and freight traffic would triple within five years,” calling it “optimistic arithmetic nobody bothered to check.” Adjusted for the far shorter life of AI chips, he argues current AI spending may already exceed the railway as a share of GDP. His thesis is parallels my own view that technology can be genuinely transformative and still disappoint nearly everyone who funds it.
His capital cycle is a very tight framework - high returns attract capital, capital builds overcapacity, returns collapse even as the technology succeeds. The railways proved it, the trunk lines survived, consolidated, became regulated utilities, and the shareholders earned 2% for thirty years. Arnold and McCartney quantified it showing that railway ROE peaked at 5.1% in 1844 and fell to 2.4% by 1849; at the York & North Midland, the pre-mania network earned 10.1% while the mania-era extensions earned -0.3%.
Society banked the progress and the people who funded it rarely shared in it.
Carlota Perez calls this the Installation phase that features Irruption, Frenzy, Turning Point, Deployment. Financial capital funds the Frenzy’s ride up the paper-wealth bubble and, in doing so, installs the infrastructure; then production capital leads the golden age. The bubble is, perversely, the mechanism that builds the thing. The Railway Mania is her canonical case, with the 1847 crash as the textbook installation-phase bust. AI sits in the Frenzy/Turning-Point zone, and the actionable call, if she’s right, is rotate from the builders to the users.
Yes, the railways transformed Britain and railway traffic grew for fifty straight years. The investors of 1845 were right about everything except their returns.
What does users mean in practice? Not the companies selling silicon or leasing GPU-hours. Not Nvidia and most definitely not CoreWeave. The deployment surplus accrues to the firms that take cheap, abundant inference and remake their own operations. Coinbases driving down their AI spending bill down while output climbs is a perfect example. Another would be the enterprises whose margins expand because intelligence became a utility input - XPO Logistics is a good example of a firm that has realized real AI ROI from its very intelligent deployment of the technology. The railways built Britain’s industrial backbone, but the winners were the manufacturers and merchants who used cheap transport to reach new markets rather than the railway companies. During the Dot-Com Boom it was the fiber builders who lost while the application layer (Google, Netflix, Amazon, Meta, etc.) all captured the surplus riding on the backs of bankrupt telecom companies.
One reason the modern version may run longer than the arithmetic predicts, with no 1840s equivalent is due to geopolitics. The 1840s Railway Mania was purely domestic. In comparison, the AI Infrastructure Boom is global and features a US-China arms race that almost assures that no administration of either party will slow it while China builds. The Bank of England could and did raise rates to choke railway speculation in October 1845. The Fed can’t choke AI investment without ceding ground Washington has no interest in realizing. This doesn’t change the arithmetic, but it could possibly change the duration and it may make a clean “controlled markdown” impossible.
The System may have to run until it physically can’t any longer.
The Economist, writing in 1855 with a decade’s hindsight, gave the verdict that may serve as the epitaph for the AI infrastructure boom:
“Mechanically or scientifically, the railways… are an honour to our age and country, yet commercially, they are great failures.”
What I’m Watching
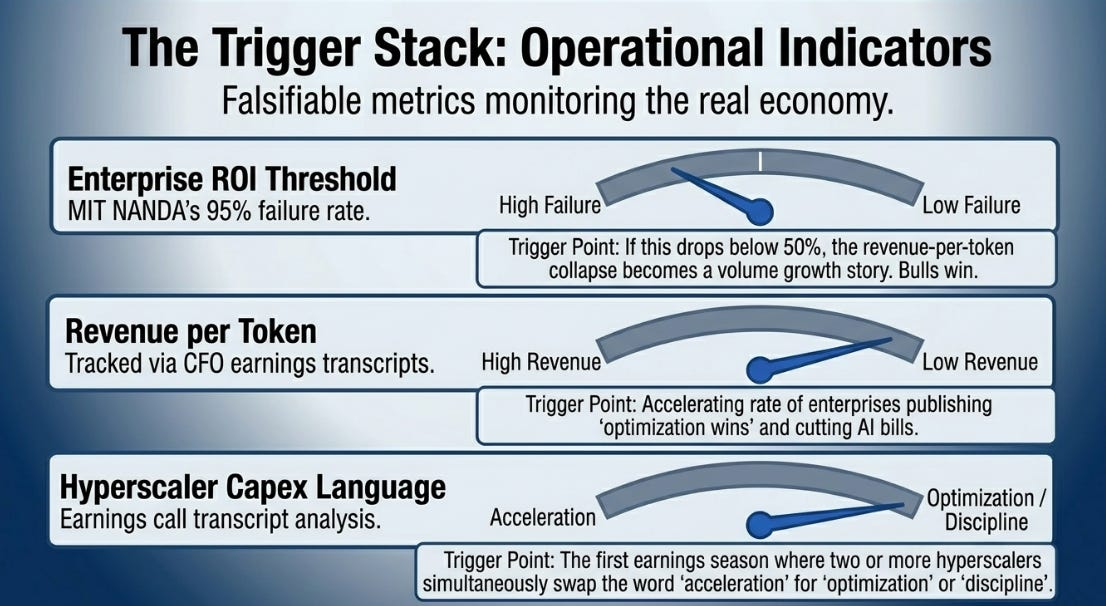
Concrete and falsifiable, with rough trigger levels, because a signal without a threshold is just a vibe. Even though we live in a “vibes-based” economy and market it doesn’t mean that we shouldn’t try to be precise.
The trigger stack: In 1845-47 the sequence was specific: Bank of England hike, Irish harvest failure, gold outflows, capital calls forcing leveraged holders to dump everything. The modern version: Fed higher-for-longer, enterprise AI budgets not renewed, a hyperscaler cutting capex guidance, a neocloud failing to refinance, GPU collateral marked down. The first domino isn’t a market event. It’s a Fortune 500 CFO telling the board the AI deployment didn’t clear its hurdle rate. Multiply by a thousand and you have the demand shock the railway passengers never delivered. Watch the enterprise, not the ticker.
Revenue per token / Revenue per watt: Armstrong’s chart is the canary. If it keeps falling at anything like this pace, Bain’s $2 trillion is unreachable at any volume. The tell is more CFOs publishing optimization wins, each one a dollar the infrastructure layer won’t collect.
The second derivative: Not whether they’re spending more, but whether the rate of increase is slowing. Railway Act approvals peaked before share prices did. The modern equivalent is capex guidance still growing but by smaller increments than the prior cycle. That’s already happening.
Capex language: The first earnings season where two or more hyperscalers swap “acceleration” for “discipline” is the modern October 1845. Meta’s July 1 move, selling “excess compute,” conceding agentic development “hasn’t accelerated as expected,” is the earliest candidate. Listen for the verb, not the number.
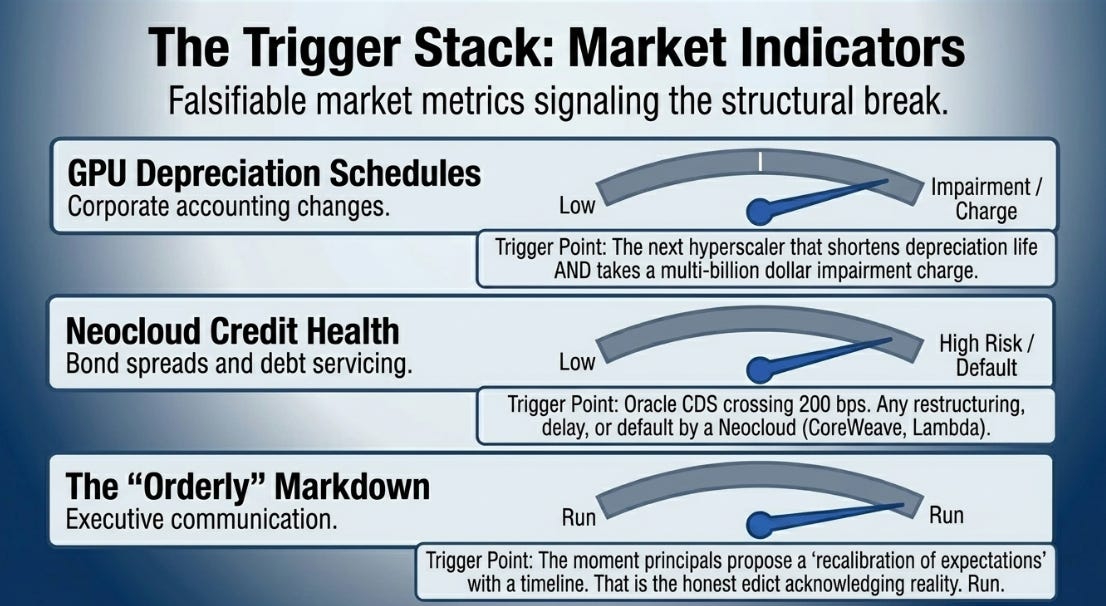
Oracle and Coreweave CDS: For ORCL spreads to move above 200 is the credit market raising its voice as it currently is doing, but above 300 is a different regime. Any neocloud restructuring, CoreWeave, Lambda, Crusoe, is the Commercial Crisis of 1847 on schedule.
GPU depreciation. Amazon’s quiet six-to-five cut was the first tell. The next hyperscaler that shortens lives and takes an impairment confirms Burry over Nvidia. There is a tipping point and when the narrative decay hits a certain threshold expect an earnings revisions cascade.
Nvidia’s data-center growth: The whole loop rests on one line item. Consensus is ~40% year over year but a print decelerating toward 25%, not even a decline, just deceleration, is the moment the echo stops sounding like a heartbeat.
The memory layer: Korean semiconductor exports track HBM/DRAM demand tightly, and with supply fixed through late 2027, their growth must peak between now and October. Memory has gone from 7% of data-center cost in 2023 to ~30% today. When Korean export growth inflects, the memory trade goes from offense to defense. Revenue per unit rhyming with revenue per mile.
Mag 7 concentration: The DeepSeek shock on January 27, 2025 vaporized ~$1 trillion of AI market cap in a day, we recently witnessed Nvidia alone shedding $589 billion in one session making it the largest single-day loss in US history. At ~33% of the S&P 500, every index fund in America is a leveraged bet on this one cycle earning its cost of capital. Not to mention that I think financials strength is a real by product of this cycle as well amongst many other satellite areas of the market and economy.
Private credit redemption queues: Maybe one of the most important item here - Cliffwater’s flagship withdrawals requests as a % of NAV has went from 5% to 14% to 17% across three quarters; similar trends have been seen across the private credit landscape. Specifically watch the software sleeve. If the queue escalates through Q3 and the tech loan book starts defaulting rather than extending, the Commercial Crisis of 1847 moves from being a historical parallel to being a catalyst that is on the calendar. And watch JPMorgan’s NAV loan book because when the biggest bank in America pays low-teens to lay off first-loss risk we should assume that it’s drawing the conclusion about the loss curve that you should draw too.
Enterprise AI ROI: The one that flips the thesis, so I watch it hardest. As mentioned I discussed it on the recent podcast and have created a formalized analytical framework that I will write on in the future in more detail. If MIT NANDA’s 95%-no-impact figure moves toward 50% or below, the revenue-per-token collapse becomes a growth story, and the bulls win. I’ll say so first if it moves. Monitor what CEOs are saying on earnings calls this earnings season to see if there is any improvement in both measuring and realizing AI ROI spend. The risk present is that alot of the initial spend was experimental not sustainable shift in spend and that could create a giant step down in earnings forecasts if that spend retreats or simply takes a pause.
The controlled markdown: Same as The New Mississippi, if you ever see the principals in charge propose an orderly deflation or a recalibration of expectations with a timeline attached, then don’t admire the responsibility. Take your capital and RUN. That’s the modern version of Law’s edict of May 21, 1720, the first public admission that the paper had outrun reality.
The CMSS score for The British Railway Mania is 86. The AI Investment Boom is 74 and climbing. Hudson understood the gap between capital deployed and revenue generated could be papered over with manufactured returns for awhile, but then he went to prison. The modern gap is papered over with circular financing, stretched depreciation, aggregate headlines that bury the per-unit rot, and fund structures that gate investors while marking opaque sleeves at prices no sale has tested. Nobody goes to prison, because none of it is illegal that we know of thus far, but take no solace in that as it doesn’t change the arithmetic.
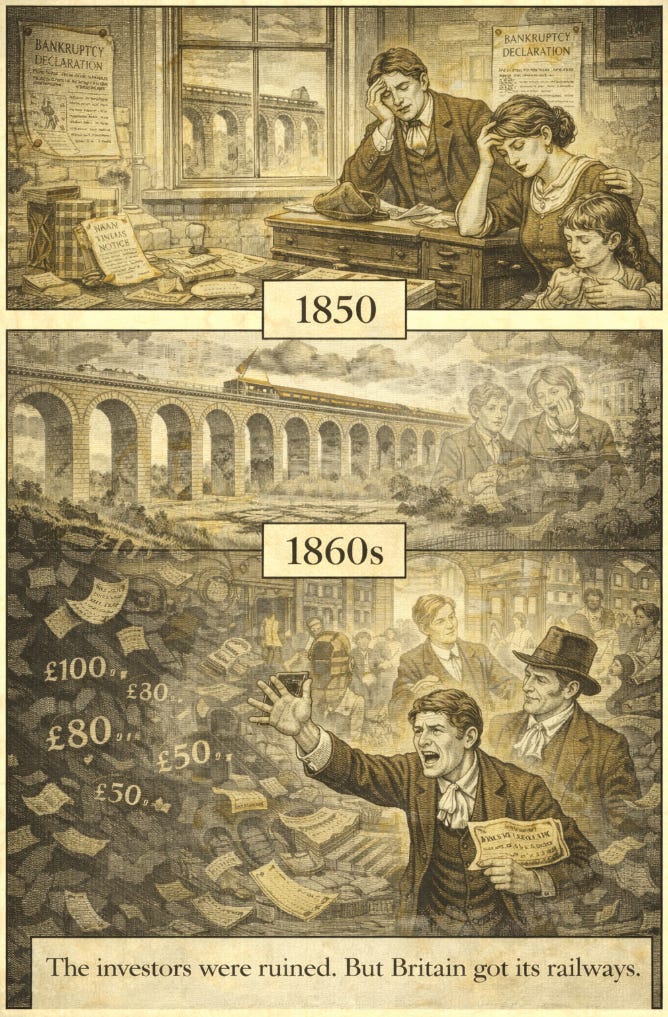
Hudson died with less than £200. His tracks still carry trains. Charlotte Brontë watched her savings melt from £120 to £20 a share and was never made whole, and the railways she’d bet on became the backbone of the largest economy on earth for a century. Newton lost £20,000 and never spoke of it again; the mechanism that ruined him outlived him by three centuries. And the Cliffwater investor who filed to redeem in full these last two quarters has gotten a fraction back. The marks say the fund is fine. The gate says otherwise.
The technology always survives. Will your capital survive is the real question.
Cheers,
Benny
First time here? I’ve been on the buy side for over two decades. Capital Misallocation™ is a 50-essay series chronicling where the money’s going that shouldn’t be, the implications on a time-weighted rather than ensemble-average basis, and what happens when the music stops. We believe markets and systems are non-ergodic and that everything obeys power laws. Below the paywall: the decks behind everything above, a few sites I’ve built, and my WhatsApp channel of professional investors, PMs, traders, and LPs.
Extra materials below the paywall: the Railway Mania deck, the CMSS Case chartbook of all 56 cases, the CMSS methodology, the AI ROI deck, the convexity trade in the AI Capex boom, and access to the AI Capex Monitor website.
Nothing here is investment advice. Contact your financial advisor before making investment decisions, and do your own work.
Sources
Odlyzko, Andrew. “Collective Hallucinations and Inefficient Markets: The British Railway Mania of the 1840s.” University of Minnesota (2010).
Odlyzko, Andrew. “This Time Is Different: An Example of a Giant, Wildly Speculative, and Successful Investment Mania.” B.E. Journal of Economic Analysis & Policy 10(1), 2010.
Odlyzko, Andrew. “The Collapse of the Railway Mania… and Robert Lucas Nash.” Accounting History Review 21(3), 2011.
Campbell, Gareth & John D. Turner. “’The Greatest Bubble in History’: Stock Prices during the British Railway Mania.” MPRA Paper 21820 (2010).
Campbell, Gareth. “Deriving the Railway Mania.” Financial History Review 20(1), 2013, pp. 1-27.
Campbell, Gareth & John D. Turner. “Dispelling the Myth of the Naive Investor during the British Railway Mania, 1845-1846.” Business History Review 86(1), 2012.
Campbell, Gareth, John D. Turner & Clive B. Walker. “The Role of the Media in a Bubble.” Explorations in Economic History 49(4), 2012, pp. 461-481.
Esteves, Rui & Gabriel Geisler Mesevage. “The Rise of ‘New Corruption’: British MPs during the Railway Mania of 1845.” CEPR Discussion Paper 12182 (2017).
Bryer, Rob A. “Accounting for the ‘Railway Mania’ of 1845, a Great Railway Swindle?” Accounting, Organisations and Society 16(5/6), 1991, pp. 439-486.
Bryer, Rob A. “Revisiting the British Railway ‘Mania’ of 1845-1846 with Marx’s Theory of Crises, Was It a ‘Great Railway Under Depreciation Swindle’?” Accounting History Review 35(1), 2025, pp. 3-65.
Hannah Rubinton and Bontu Ankit Patro, “Tracking AI’s Contribution to GDP Growth,” St. Louis Fed On the Economy, Jan. 12, 2026.
Arnold, A.J. & S. McCartney. “The Beginnings of Accounting for Capital Consumption: Disclosure Practices in the British Railway Industry, 1830-55.” Accounting and Business Research 32(4), 2002, pp. 195-208.
Arnold, A.J. & S. McCartney. “Were They Ever ‘Productive to the Capitalist’? Rates of Return on Britain’s Railways, 1830-55.” Journal of European Economic History 33(2), 2004, pp. 383-410.
McCartney, S. & A.J. Arnold. “The Railway King’s Midland Railway, 1844-1857: A Study in Accounting and Finance.” Journal of Industrial History 4(2), 2001, pp. 94-116.
Chancellor, Edward. Devil Take the Hindmost (1999); Capital Returns (2015).
Perez, Carlota. Technological Revolutions and Financial Capital (2002).
Brynjolfsson, Rock & Syverson. “The Productivity J-Curve.” AEJ: Macroeconomics 13(1), 2021.
Cahn, David. “AI’s $600B Question.” Sequoia (2024). · Bain & Company. Global Technology Report (2025). · Allianz Research (March 2026). · MIT / Project NANDA, “The GenAI Divide” (2025).
Burry, Michael (@michaeljburry). GPU depreciation thread (Nov 2025) and Nvidia’s rebuttal. · Ho, Ricky (@rickyho_1989). “The Economics of Intelligence” (June 2026). · Armstrong, Brian. Coinbase AI spend / token usage (X, June 2026).
Gabaix & Koijen, “The Inelastic Markets Hypothesis.” · Green, Krishnan & Sturm, “A Model for Passive That Breaks the Market” (2026). · Ole Peters, “Ergodicity Economics,” Nature Physics (2019).
Unicus Research LLC, CCLFX / private-credit series (June 2026). · ECB Financial Stability Review, May 2026. · BIS Quarterly Review, March 2026. · Cliffwater Corporate Lending Fund, SEC EDGAR filings (CIK 0001735964). · S&P Global Ratings, CCLFX outlook revision (March 2026).
Capital Misallocation Database v2.1, Cases #06 and #49. Deductive Capital.
Keep reading with a 7-day free trial
Subscribe to Capital Misallocation to keep reading this post and get 7 days of free access to the full post archives.