
The South Sea Machine : "The Other Bubble of 1720"
The Forced Buying Machine that Broke Isaac Newton is Now Installed in your 401(k)


This is the 2nd of 50 essays on Capital MisallocationTM that I plan to publish and is the sequel to my last essay - The New Mississippi. If you have yet to read it here is the TLDR version: John Law invented modern monetary policy, inflated the first transatlantic bubble, and destroyed France’s middle class in the process. In that piece I laid out the historical analog betwen the infamous Scottish genius and our current version of Law - Elon Musk. This piece is about the other bubble of 1720, the one with better financial engineering and a more instructive villain. I explore the mechanics more rigorously and compare “The Other Bubble of 1720” to the broad equity market and specifically the SpaceX IPO - a deal that The Squirrel and I have covered at length on here as well as on our podcast Benny & The Squirrel. As any good trader would, I then explore what would falsify the argument and then close out the essay with a few thoughts and conclusions.
Enjoy!
ACT 1:
THE LEDE: Master of the Universe, Fool of the Market
Every bubble needs a buyer who has no choice. Not a greedy one, not a stupid one necessarily, but a buyer whom the rules require to show up. In 1720, the most famous victim of that machine also happened to be the smartest man alive.
Sir Isaac Newton is historically regarded as one of the greatest minds every bestoweed upon the human race, but even with all that intellectual horsepower he was sucked in and thoroughly ran over by “The Other Bubble of 1720” - the South Sea Bubble.
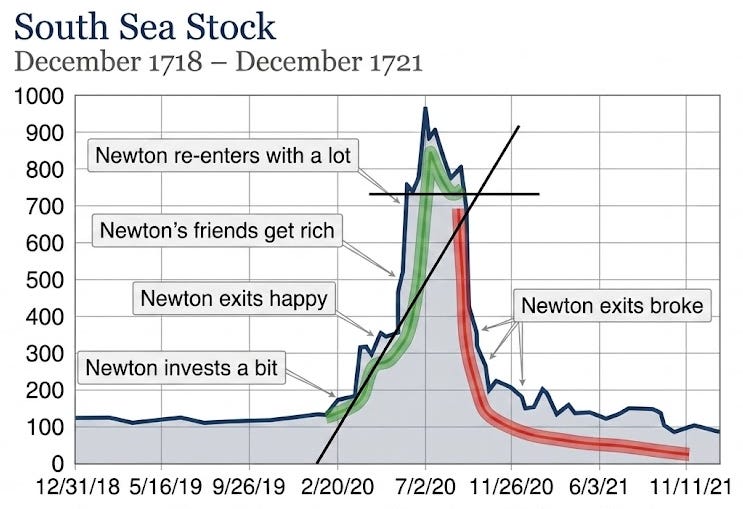
To Newton’s credit he got long shares of the South Sea Company (SSC) early and, importantly, near the inflection point at around £300 per share reportedly. Then he responsibily exited with a handsome profit and then walked away with an excellent trade - exactly as a rational calculating market participant is supposed to behave. He even reportedly told numerous people about exiting and then lectured them on how it was the correct move, which is the motivation of the video I created and included above. Again, Sir Isaac Newton was the smartest human in England at the time (David Hume, the only legit competitor for that title, was only nine years old) and, as you would expect, he played the game extremely well ... initially.
Unfortunately, just like many people today chasing memory stocks, the professor was unable to control his emotions and jealousy of watching others get rich. Then he watched his banker neighbor’s wealth double, he watched a duke’s triple, and then he watched a man who couldn’t do long division become richer than him by a factor of two in less than three months. Reportedly, the subscription lines for SSC shares stretched out the door and down the alley outside the exchange. Pamphlets were everywhere promoting the stock and the whisper network - what we would now call social media with better attire - was in unanimous agreement: SSC shares are “Up Only” to borrow a modern bubble phrase.
Seeing all his neighbors and friends making (perceived) life-changing wealth led him back to the price board on Exchange Alley only to watch the number that he had correctly walked away from go vertical (see Micron shares today) causing his FOMO to go vertical as well.
“Nothing so undermines your financial judgment as the sight of your neighbor getting rich.” ~ J.P. Morgan
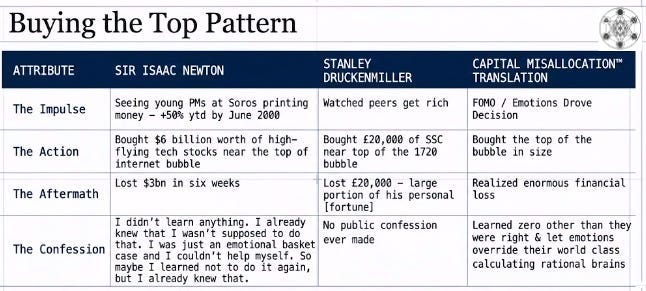
Newton re-entered the SSC trade in June 1720 somewhere north of £700 per share. The greatest mathematical mind of his generation, the man who invented calculus to explain the motion of planets, stood in a line and handed over an enormous amount of his hard-earned money because he simply was unable to stand watching his less intelligent peers get rich owning something he had already decided to leave on the table. According to John Craig in Newton at the Mint, Newton’s documented loss was £20,000, a meaningful portion of the wealth he accumulated over his lifetime. Although some subsequent historians have placed it lower it doesn’t change the facts on the sequence of events that have plagued so many market participants over time.

Sir Isaac Newton: Master of the Universe, Fool of the Market
As a quick detour, I want to point out that it’s not just non-professionals that let emotions take over their rational brains and buy at the height of financial bubbles. Stanley Druckenmiller, one of the greatest traders in history, bought $6 billion of tech stocks at the height of the internet bubble 26 years ago.
“So, I’ll never forget it. January of 2000 I go into Soros’s office and I say I’m selling all the tech stocks, selling everything. This is crazy at 104 times earnings. This is nuts. Just kind of as I explained earlier, we’re going to step aside, wait for the net fat pitch. I didn’t fire the two gun slingers. They didn’t have enough money to really hurt the fund, but they started making 3 percent a day and I’m out. It is driving me nuts. I mean their little account is like up 50 percent on the year. I think Quantum was up seven. It’s just sitting there.
So like around March I could feel it coming. I just – I had to play. I couldn’t help myself. And three times during the same week I pick up a phone, don’t do it. Don’t do it. Anyway, I pick up the phone finally. I think I missed the top by an hour. I bought $6 billion worth of tech stocks and in six weeks I had left Soros and I had lost $3 billion in that one play. You asked me what I learned. I didn’t learn anything. I already knew that I wasn’t supposed to do that. I was just an emotional basket case and couldn’t help myself. So, maybe I learned not to do it again. but I already knew that.”
~ Stanley Druckenmiller
It makes you really wonder about what it is that drives humans mad during financial bubbles if one of the smartest mathematical minds in history and one of the best traders in history also succumbed to this behavior against their better judgement. We discussed Newton’s initial entry and early exit above but it should be noted that Druckenmiller actually had already lost $600m trying to short tech stocks on an initial $200m short. So clearly he knew it was irrational and sold early just like Newton. However, being a world class speculator, Stan sold shares in the hot securities of the day before buying whereas Newton just sold the shares he purchased early.
After over 20 years of participation in markets and trading, I believe that the skill that actually separates the best investors isn’t intellectual ability but, rather, the ability to harness their emotions. In essence, the traders who can handle the most pain & not put themselves into positions of weakness with poor liability structures (i.e. leverage & short-term funding) are the ones able to avoid these dramatic instances of capital loss. As we will discuss later, life and markets are non-ergodic and so avoiding the absorbing barrier of left tail events can lead to superior results even without ever achieving banner up years through the power of geometric compounding.
The historically revered genius that possessed the brain that gave us calculus never once talked about this financial tragedy of a decision publicly. The embarrassment of the position was worse than the money.
Three hundred years later, a different kind of forced buyer showed up. Similarly, it has no emotions at all.
ACT 2:
THE MECHANISM: The South Sea Company

The South Sea Company was not primarily a trading company. It was a financial instrument with a good story attached.
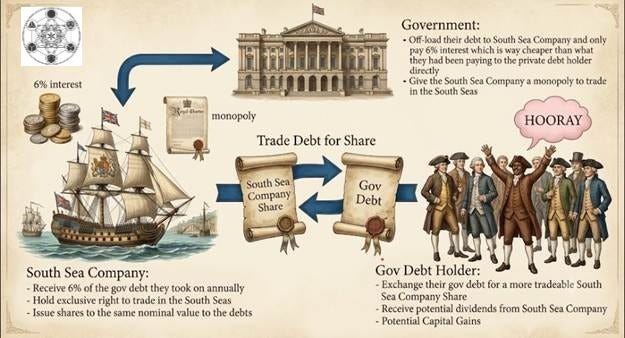
In 1711, England had a problem on its hands. The previous nine years of war against France had generated approximately £10 million in unfunded government debt: specifically, floating “short annuities” that The Crown owed to various holders but couldn’t cleanly service. Lord Treasurer Robert Harley needed to restructure the debt and, along with John Blunt, came up with an elegant solution. These two early financial engineers conjured up the idea of converting the annuities into equity in a newly chartered company, the South Sea Company, which received in exchange a monopoly on trade with Spanish South America.
An annuity, to be precise, is a fixed periodic payment: think a government bond that pays you £50 a year for a defined term. The annuity holders back in 1711 were receiving stable, predictable income from The Crown. Blunt’s offering converted legacy annuity holders’ income stream into an ownership stake in a commercial enterprise. Like with all convertible bonds, the conversion ratio mattered enormously given that it determined whether you were made whole, enriched, or quietly robbed. John Blunt set the ratio to benefit the SSC’s balance sheet, not the annuity holder - a move that bagholders have witnessed for the subsequent three centuries.
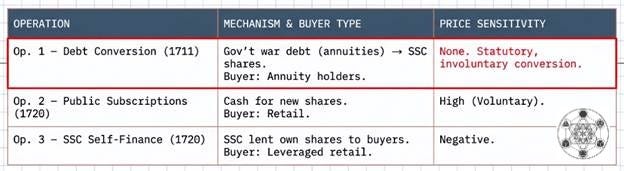
We will refer to this maneuver as Operation 1, and it is precisely the mechanism that this essay’s thesis depends on the most. The annuity holders did not choose to become shareholders as Parliament voted them into shares and the conversion was statutory with no opt-out clause. If you held a short annuity, you held SSC stock at whatever conversion ratio the directors had set and at whatever price the market assigned. This operation was one of the earliest debt-for-equity swaps in financial markets at scale in history.
This is the 1st Category of Forced Buyer: Statutory + Price-insensitive + No discretion.
Three Structurally Distinct Financial Operations
Operation 1 is the one that matters for the structural argument. Operation 2 and Operation 3 are the mechanics that drove the ensuing mania that, as discussed above, had such a strong siren call that it even seduced the father of classical mechanics to tragic loss. The annuity holders were something different: they were the original price-insensitive buyers, the ones whose conversion gave the SSC its initial market weight and its first artificial floor.
John Blunt, merchant, projector, and the most consequential financial architect of the early eighteenth century, understood something that Newton didn’t: the rule was the product. The trade monopoly was marketing. South American ports were mostly closed to British ships. In the nine years between the company’s founding and the 1720 mania, the SSC conducted almost no meaningful commerce with South America at all. What Blunt sold to Parliament was a mechanism: debt disappears into equity, and the company gets to set the terms. As Larry Neal documents in The Rise of Financial Capitalism (1990), the SSC’s real business model was the conversion arbitrage. The underlying asset was the government’s debt obligation. The story was just the story.
The share price wasn’t a reflection of business value. It was the input to the conversion formula. The company’s financial health depended on keeping the price up long enough to complete the conversion at favorable terms and exit.
The SSC was essentially a government-sponsored hedge fund that got to write its own rebalancing rules. What could go wrong?
ACT 3:
THE ERGODIC LENS: Physics of Financial Ruin
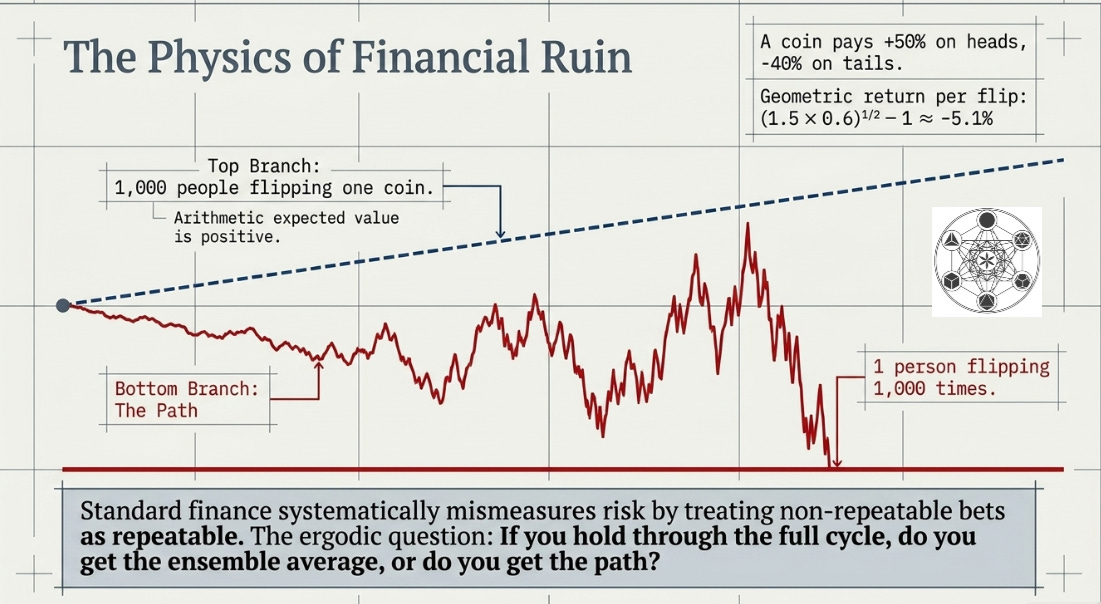
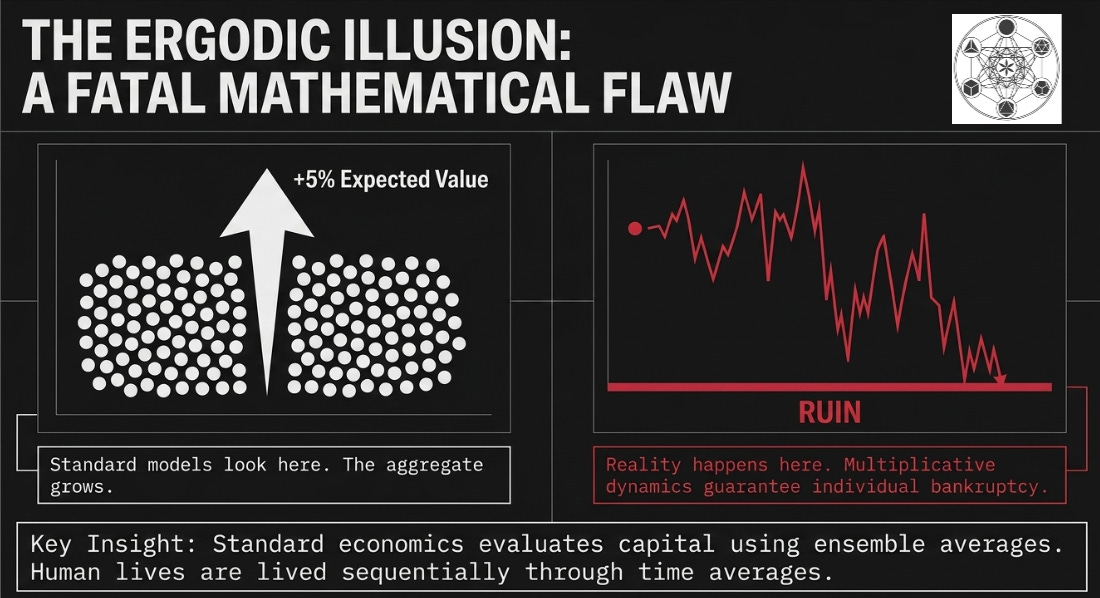
Flip a coin that pays +50% on heads and −40% on tails. Across 1,000 people who each flip once, the average looks positive. For one person flipping 1,000 times, the sequence converges to ruin: you’re multiplying, not averaging. The geometric return per flip is negative even though the arithmetic expected value is positive.
The math behind that assertion is as follows:
(1.5 × 0.6)^½ − 1 ≈ −5.1%
Ole Peters spent the better part of a decade at the Santa Fe Institute formalizing this distinction. He calls it ergodicity economics. The core insight: expected value calculations break when you can’t repeat the experiment. Peters published the framework in “Ergodicity Economics” (Nature Physics, 2019). Standard financial theory systematically mismeasures risk by treating non-repeatable bets as repeatable ones.
The ergodic question for any position: if you hold through the full cycle, do you get the ensemble average, or do you get the path? For most people, you get the path. The path includes the crash.
When I set out on first defining and then populating a list of the largest 50 instances of Capital MisallocationTM, I immediatley realized I needed a way to measure them to put them on an apples to apples basis. I leaned heavily on Ole Peters work and thought alot about my friend David Dredge, CIO of Convex Strategies, as well as Mark Spitznagel writing on the topic in his book “Safe Haven: Investing for Financial Storms.” The traditional manner of measuring disaster is strictly on a dollar of damage basis. The issue with that historical comparions lose credibility and it says nothing about the percentage of the population that saw their lives hit the lower absorbing barrier of ruin due to the Capital Misallocation of that particular instance in space time. I settled on the scoring system and then ranked over 100 instances of modest to severe capital misallocation. I then recursively whittled down that list to 50 that you will be able to read about on here over the next 18-24 months. Below you will find a rough summary of the meaning of each score. Note that even though I used a linear 1 - 5 rank value system the reality is that in degree of damage the ruin inflicted rises in a very non linear rate especially as the Ergodic Score rises.
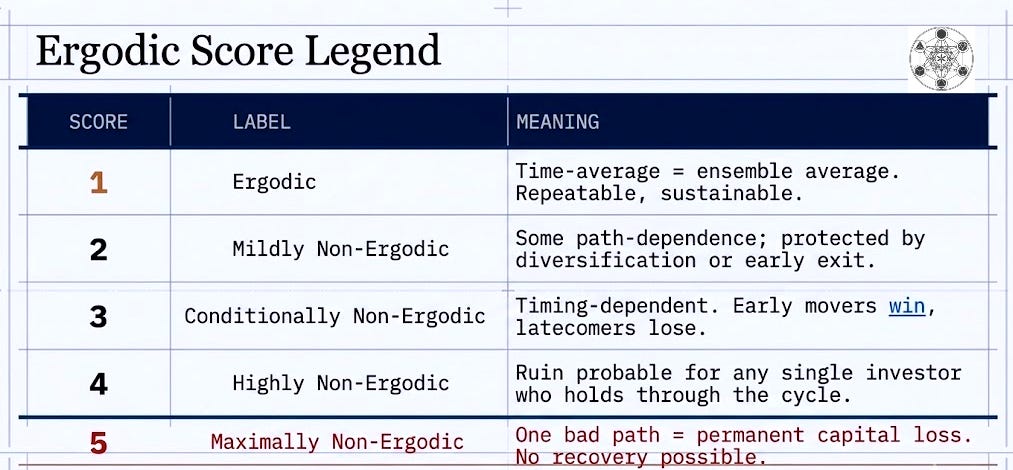
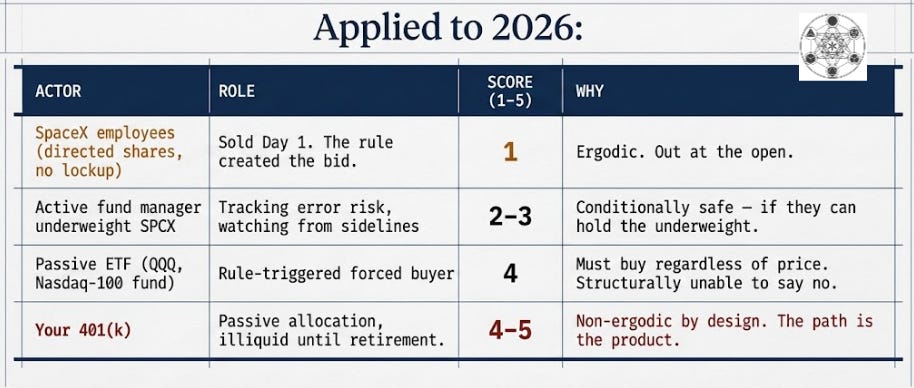
These scores reflect realized outcomes, not ex-ante probabilities. At the time of entry, most participants could not reliably distinguish their position from a more favorable one.
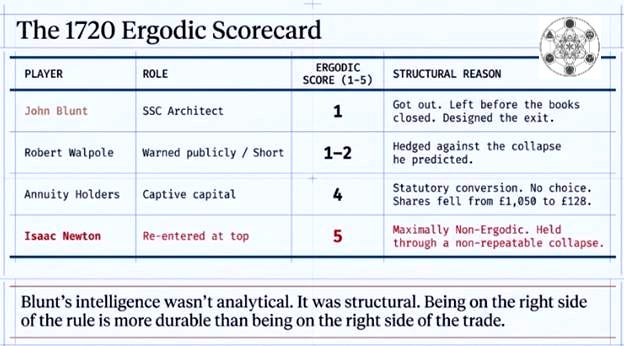
The architecture of that table is the point. Blunt scored 1 not because he was smarter than Newton in any abstract sense (Newton, by most measures, was the more capable mind). Blunt scored 1 because he designed a system that guaranteed his exit while others held the float. The intelligence that mattered wasn’t analytical. It was structural. He understood that being on the right side of the rule was more durable than being on the right side of the trade.
Newton’s £20,000 loss wasn’t irrationality. Dale et al. (2005) document that the market wasn’t obviously mispriced on ensemble metrics even at elevated prices. Newton’s problem wasn’t a miscalculation of the ensemble.
Sir Isaac’s problem was that he held a non-ergodic position through a non-repeatable event, and it was THE PATH that killed him.
ACT 4:
THE MODERN MACHINE: Inelastic Markets

SpaceX went public on June 12, 2026 at $135 per share, achieving a $1.77 trillion valuation on day one. The float was 555.6 million shares (approximately 4.2% of the 13.1 billion shares outstanding). The remaining 95.8% was locked.
Elon Musk holds approximately 6.1 billion shares (849 million Class A, 5.2 billion Class B, including restricted shares). His lockup expires one year after the IPO, June 2027 at the earliest, with no provisions for early release under any scenario the SpaceX 424B-4 prospectus contemplates. He retains approximately 82% of voting control through a dual-class structure with Class B shares carrying ten votes each. The company went public at a $1.77 trillion valuation with a structure that makes hostile action or forced dilution essentially impossible.
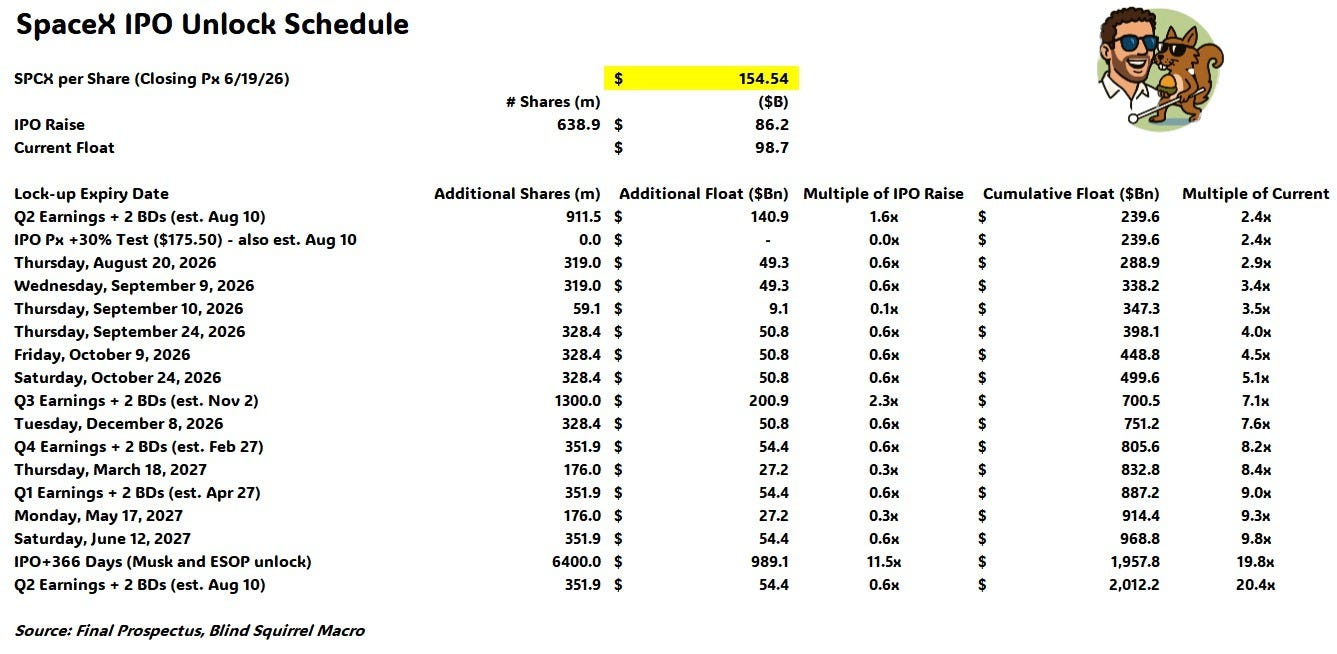
The lockup isn’t a single cliff. It’s structured as seven separate tranches releasing between August and December 2026. The largest single tranche (approximately 1.3 billion shares) corresponds to the Q3 earnings window. Before that, the float stays thin. The Squirrel kindly sent me the detailed lockup schedule that you see below so you don’t have to take my word.
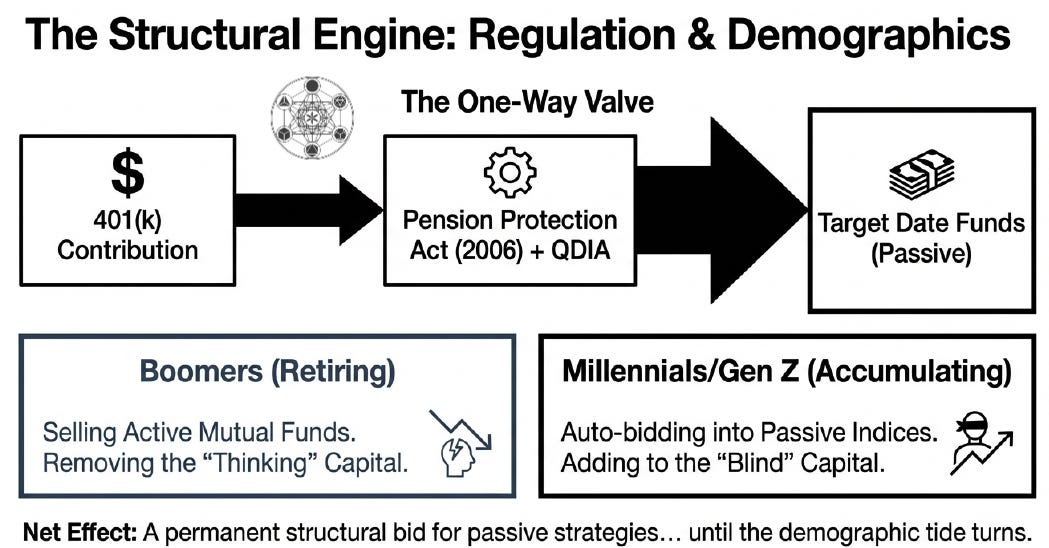
The Nasdaq Fast Entry rule is where this becomes a mechanism rather than a story.
Standard index inclusion (S&P or Nasdaq adds a new constituent) involves a pre-announcement window of days to weeks. Passive funds accumulate over time. Arbitrageurs front-run the announcement, provide liquidity, absorb price impact. Imperfect, but it distributes the forced-buy pressure. The Tesla S&P 500 inclusion in September 2020, the last large comparable, generated approximately $50 billion in passive demand across a quarter with meaningful float and substantial short interest to absorb it. Note some of that short interest was from your author whom wishes he understood all these dynamics back before the inclusion. My friend, and former guest of Benny & The Squirrel, Mike Green observed on a recent episode of the Excess Returns podcast that the Tesla situation “pales in comparison” to what is implied within the SpaceX structure.
If you are interested in a deep discussion on The Inelastic Market Hypothesis and like a jovial high level financial markets conversation you should watch the episode of Benny & The Squirrel when we had Mike on as a guest.
The Nasdaq Fast Entry rule change collapses that window to 15 trading days from listing without either a seasoning period or a liquidity requirement. SpaceX’s market cap at $1.77 trillion exceeds the smallest Nasdaq-100 constituent by a margin that makes the question academic. The revised weighting methodology caps index weight at three times a security’s free-float-adjusted market capitalization which mechanically inflates index weight and mandatory purchase obligations beyond what the available float can absorb. As the SEC comment filed by Christon Khong (SR-NASDAQ-2026-004) argues, this structure treats a thinly floated stock as if it had a much larger tradable supply, “creating incentives for index inclusion strategies that may not align with long-term market quality.” Passive funds like QQQ are compelled to buy algorithmically, at whatever price the market presents, because the rule mandates them to do it not because they are excited about buying it at the valuation implied by the market price.
The QQQ ETF alone manages approximately $490 billion in assets as of June 2026. The full Nasdaq-100 ecosystem, which includes the QQQ plus every ETF, levered ETFs, mutual funds, and institutional mandates benchmarked to the index) is approximately $1.5
trillion. Even a modest weight assignment generates a forced-buy obligation measured in billions of dollars, aimed at a float of 555.6 million shares.
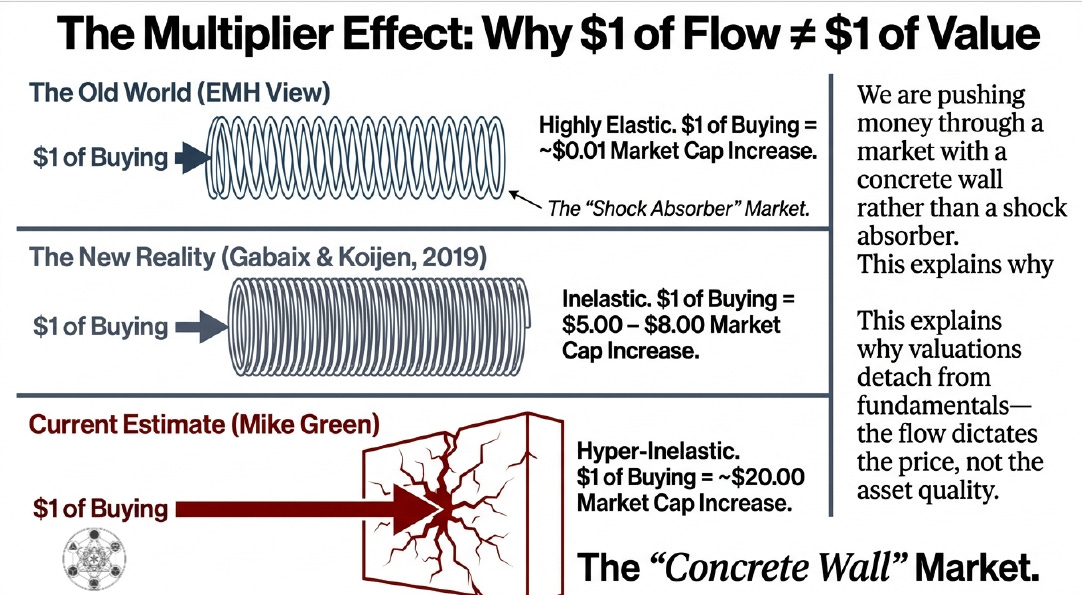
The Gabaix-Koijen inelastic markets framework estimates that $1 of passive inflow drives $5 – $8 of price impact due to inelastic supply. This means that every dollar of forced buying moves the price 5x - 8x more than expected in the elastic market framework most participants have been taught and operate with still to this day. When Mike was on our podcast he relayed to The Squirrel and me that he believes that inelasticity could be as high as 20:1 now. At a float this thin, that multiplier doesn’t compress as the supply math is explicit - passive demand heading into the inclusion window is approximately two times the available float. Two times. Before the first insider is even eligible to sell into it.
Green’s own formal research underscores why this is not merely a liquidity inconvenience but a structural fragility. In March 2026, Green, Hari Krishnan, and Stephan Sturm published an excellent paper titled “A Model for Passive That Breaks the Market.” In that paper they layout a CIR-based mathematical model demonstrating that once passive share crosses approximately 65% of equity ownership, index volatility increases at a cubic rate. If passive share rises above roughly 83–87% ownership, the authors predict that market stability breaks entirely even without any outflows. The model treats 83% as an outer bound, and Green himself estimates we are currently at approximately 55% passive by market share, gaining about 4% per year. The paper’s co-author Sturm presented it at HKUST under the title “Passive Fragility” and stated the conclusion plainly - “the major indices have a positive probability of hitting 0 before rebounding, over any finite time interval” once the threshold is crossed. SpaceX’s 4.2% float does not need to wait for that aggregate threshold. It arrives at the micro level on day one making it a single security where passive demand already exceeds available supply by a factor of two. The macro fragility Green and others model for the market as a whole is playing out on a miniature relative scale in a single name.
The structure is the same. The forced buyers changed.
This is not an argument that I think SpaceX equity is worthless. It’s an argument that the price you pay when a rule forces someone to buy has nothing to do with what SpaceX is worth on a strictly fundamental basis.
The rocket is real. The rule is what sets the price.
Green’s recently explained to me on the phone that his analysis shows that passive flows alone are contributing approximately 18% per year in endogenous price appreciation to the largest U.S. equities — more than many of those stocks have actually appreciated over recent years. The implication is that fundamentals are not driving the marginal price. The flow is the actual price driver. In his 2020 white paper “Policy in a World of Pandemics, Social Media and Passive Investing,” Green wrote that these vehicles are “not passive investors”, they are mindless systematic active investors with zero interest in the fundamentals of the securities they purchase.”
John Blunt would have recognized the archetype immediately: a buyer that shows up because the rule says so, at whatever price the market presents, with no discretion and no exit clause.
If you look closer at the lockup table above you see that it’s structure confirms the supply math. The seven tranches that are scheduled to be unlocked in the final five months of 2026 release supply gradually, but into a float that was already architecturally insufficient for the passive demand queued behind it. The largest single release, ~1.3 billion shares around Q3 earnings, arrives after the initial passive inclusion wave has already set the price. Insiders selling into the first tranche are selling into a bid that government and SEC approved passive mandates have created. The people who need the exit in month six are selling into whatever is left.
Your retirement account is buying a ~$1.8 trillion company at a 4.2% float from the people who got in orders of magnitude lower.
The market is working exactly as designed.
ACT 4.5:
THE SIMULATION: Attempt to Falsify
I ran this analysis in an attempt to try to falsify the thesis. Note that I am aware of the shortcomings of a stateless ergodic analysis, especially funny considering I dedicated a whole section to non-ergodicity above but I think it was a worthwhile mental exercise nonetheless.
The model takes the variables listed below and then simply grinds them against each other until something breaks.
Key Variables
passive index demand
available float
buyback supply
lockup release schedules
The question at hand is fairly simple - “At what point does cumulative passive demand exceed the float available to absorb it?”.
That precise moment is akin to the Rubicon in that once you cross it, there is no turning back, or in this case there is no longer any active counterparty pricing shares against fundamentals.
Figure A Float Ratio Fan Chart:
Four scenario paths for demand/float ratio across a 12-month post-inclusion window.
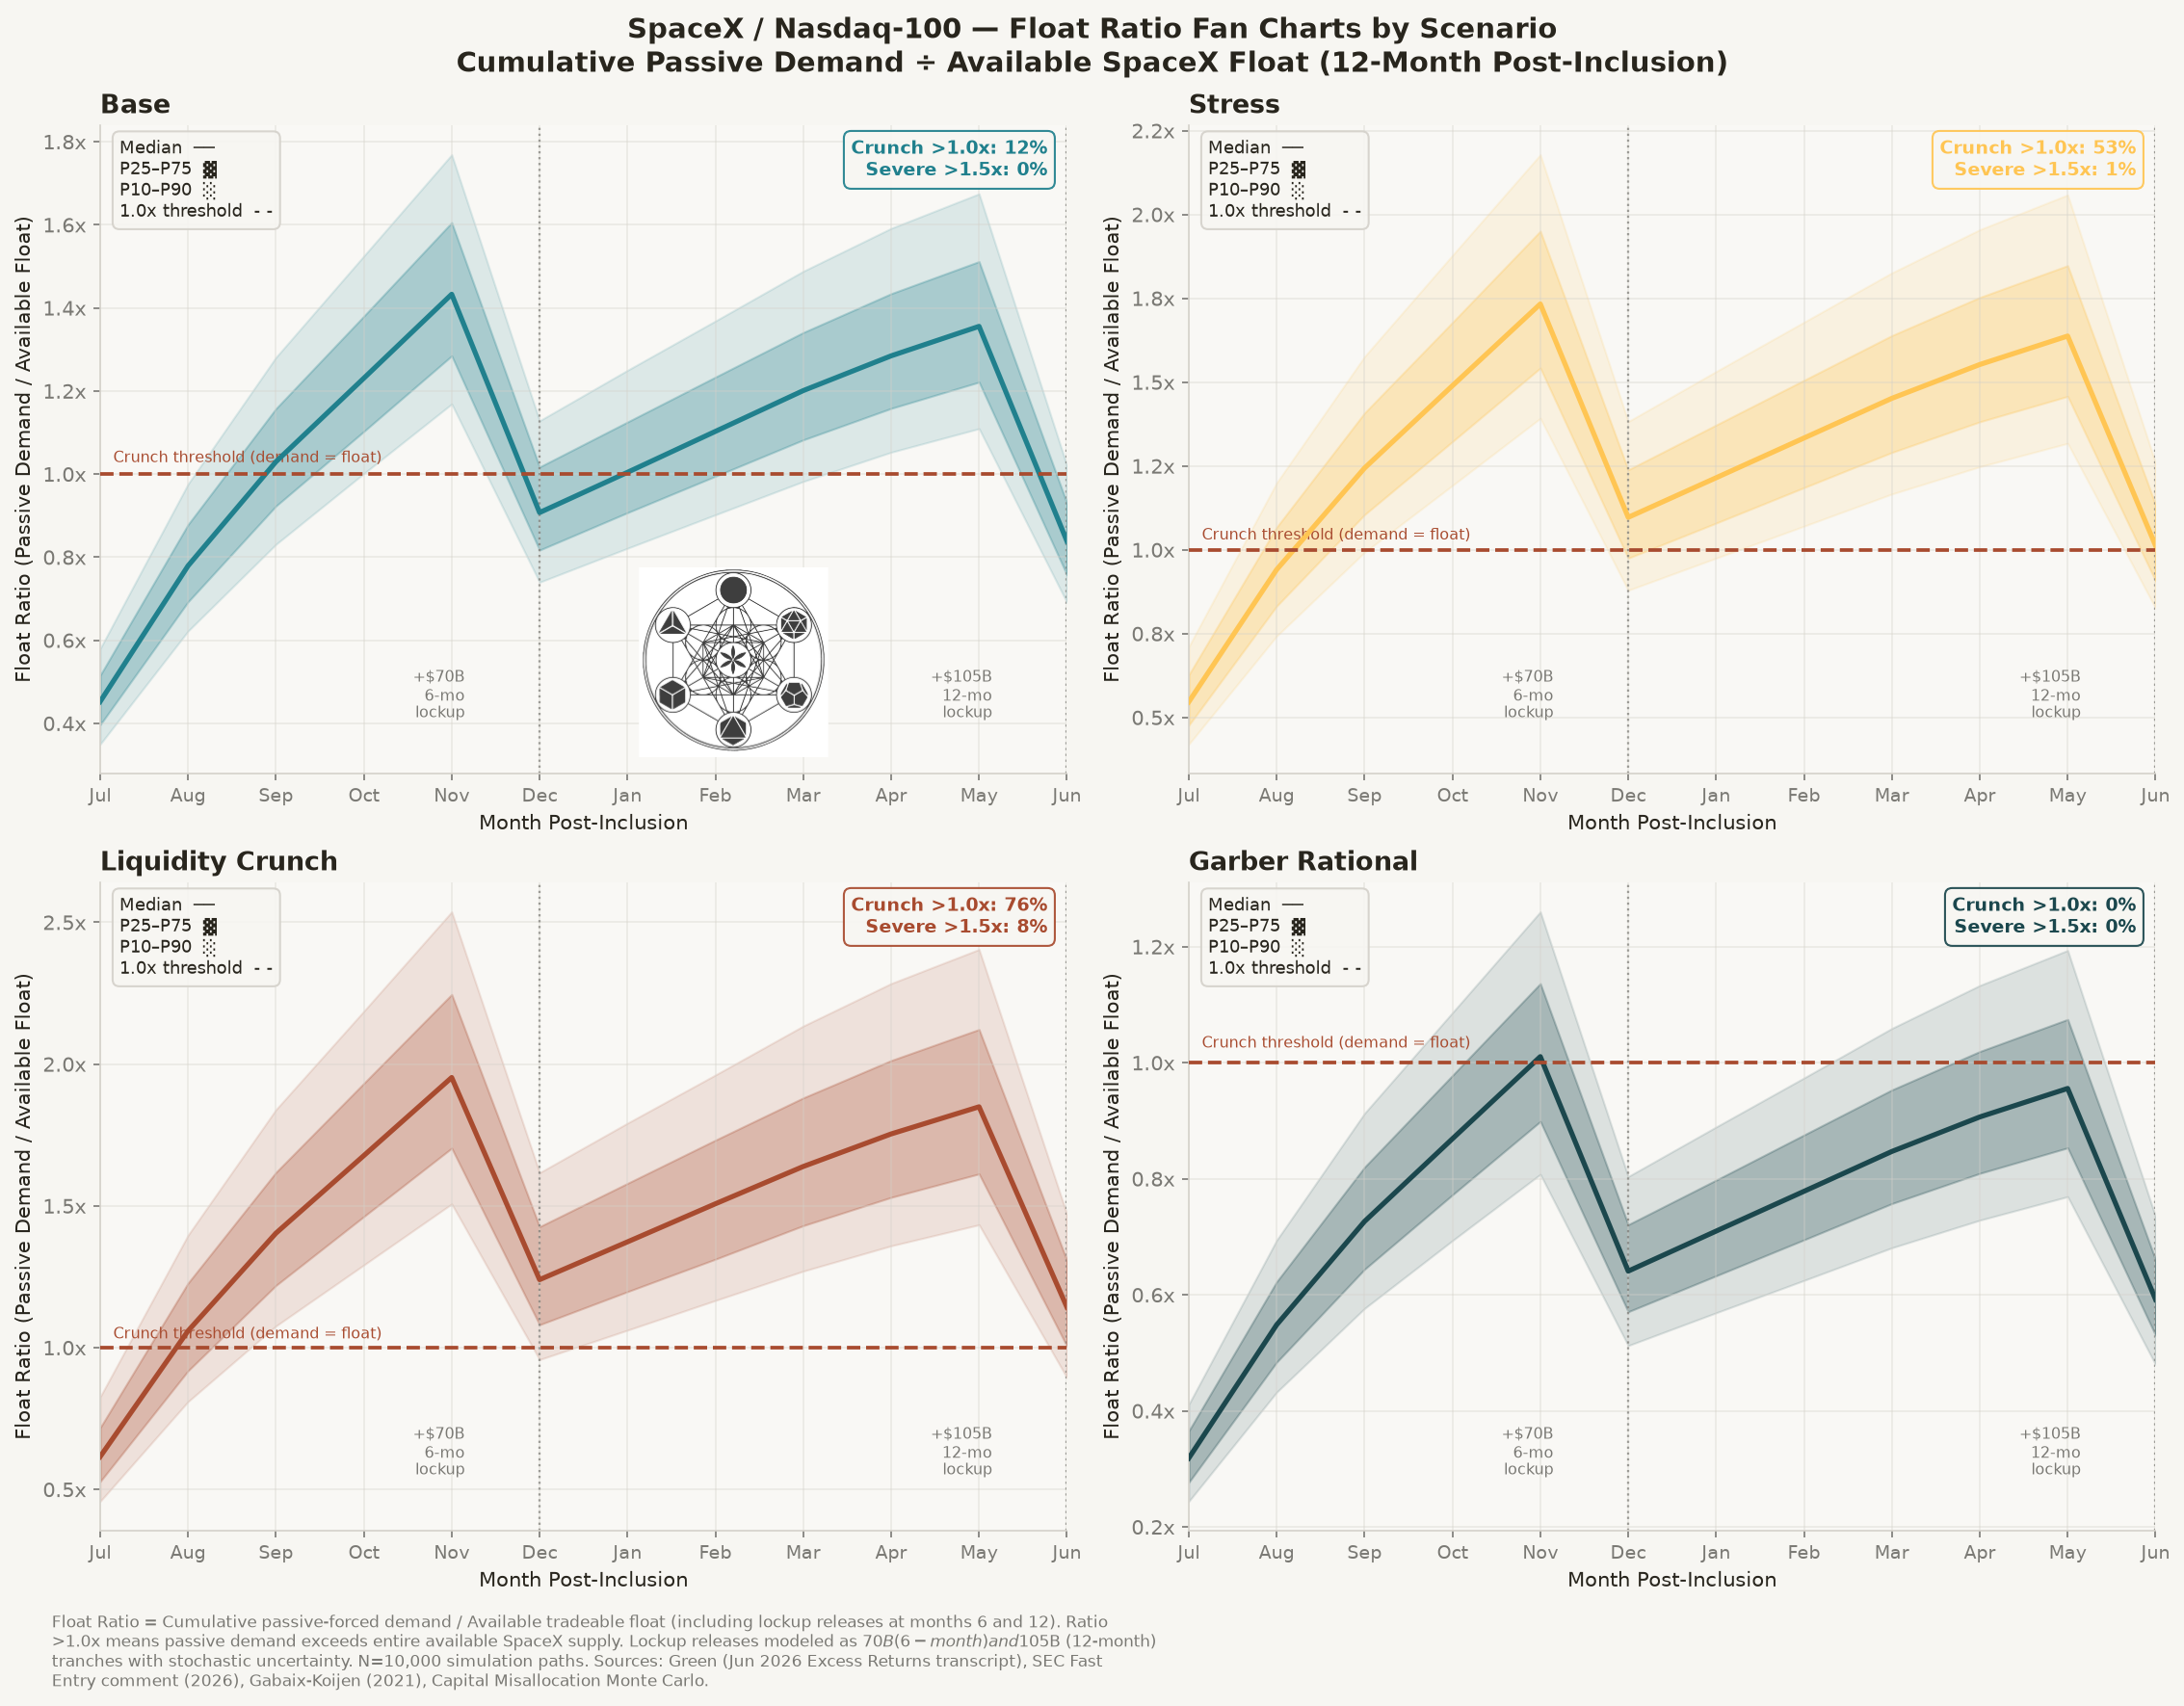
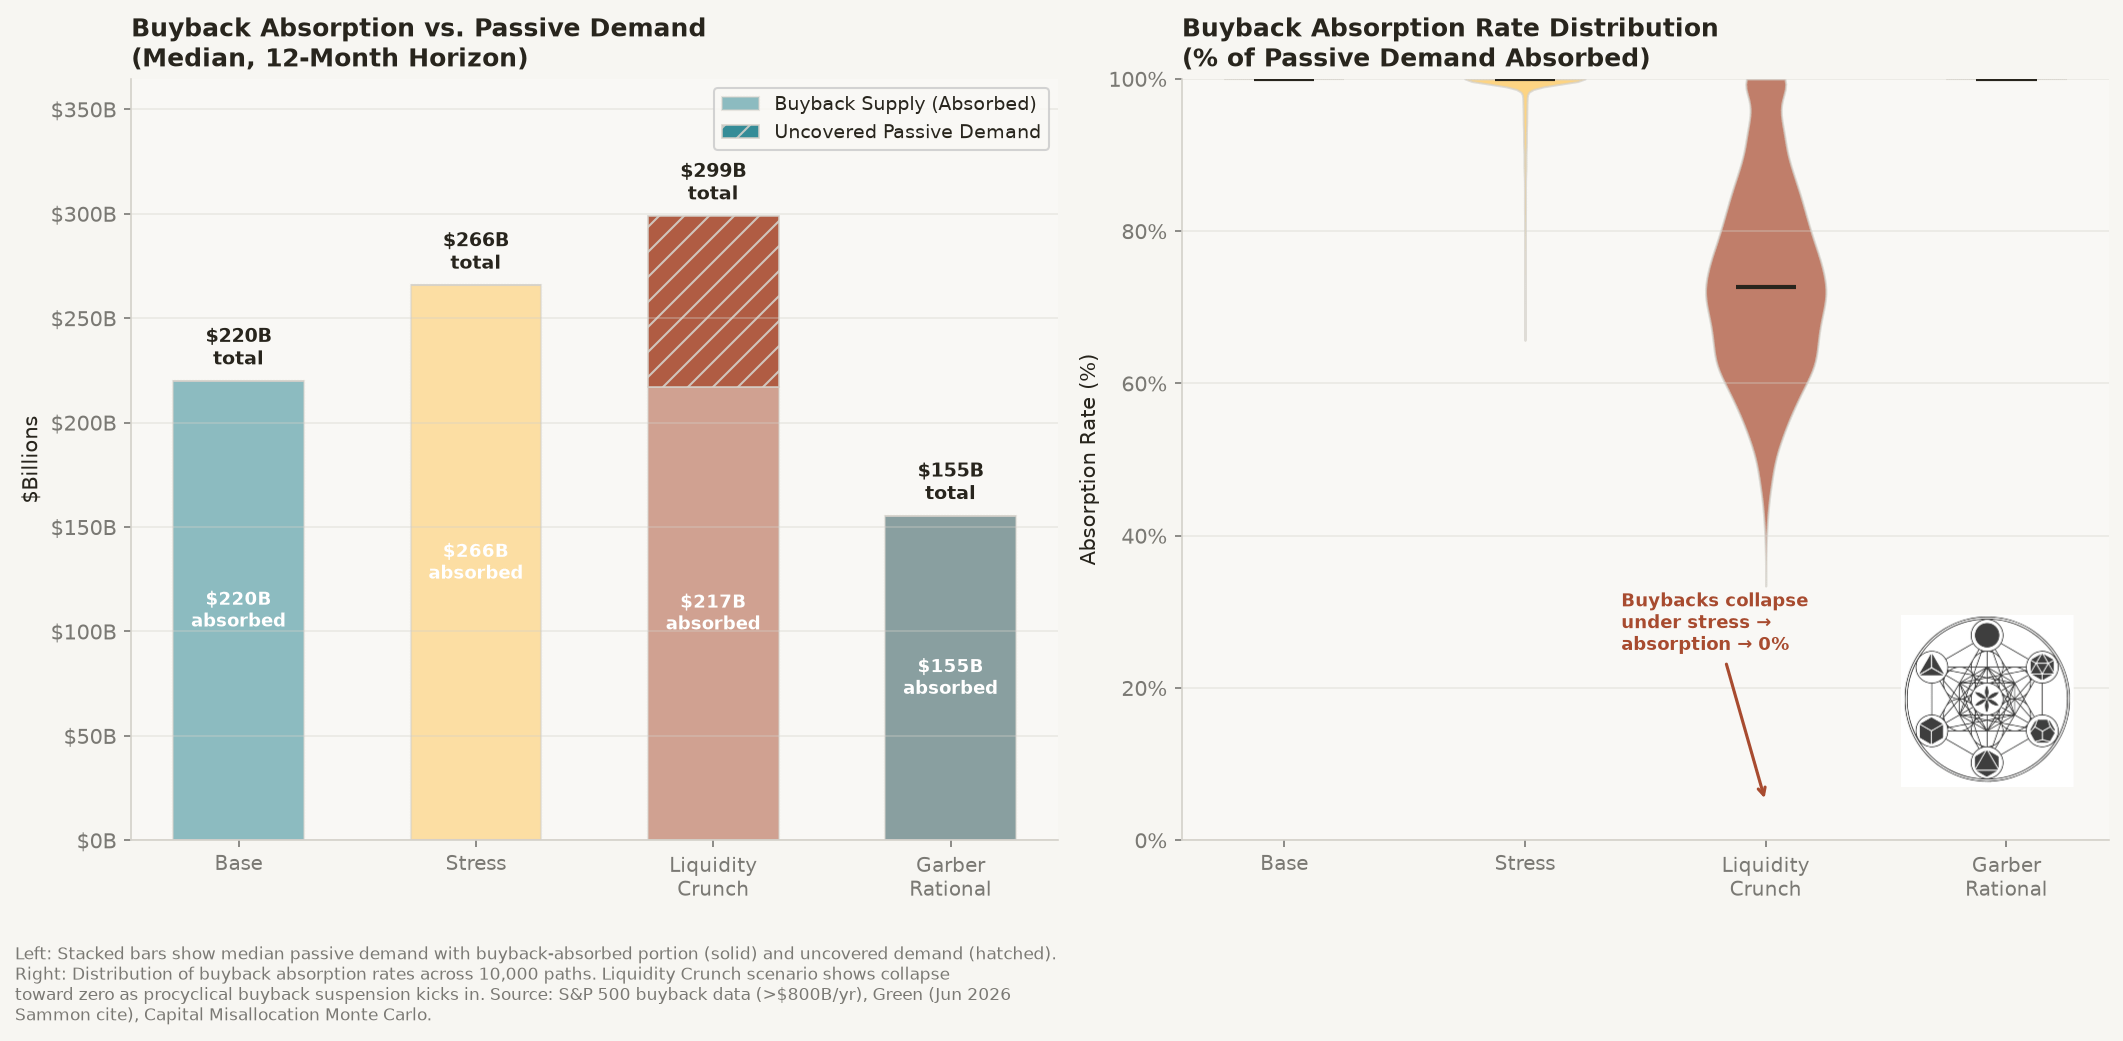
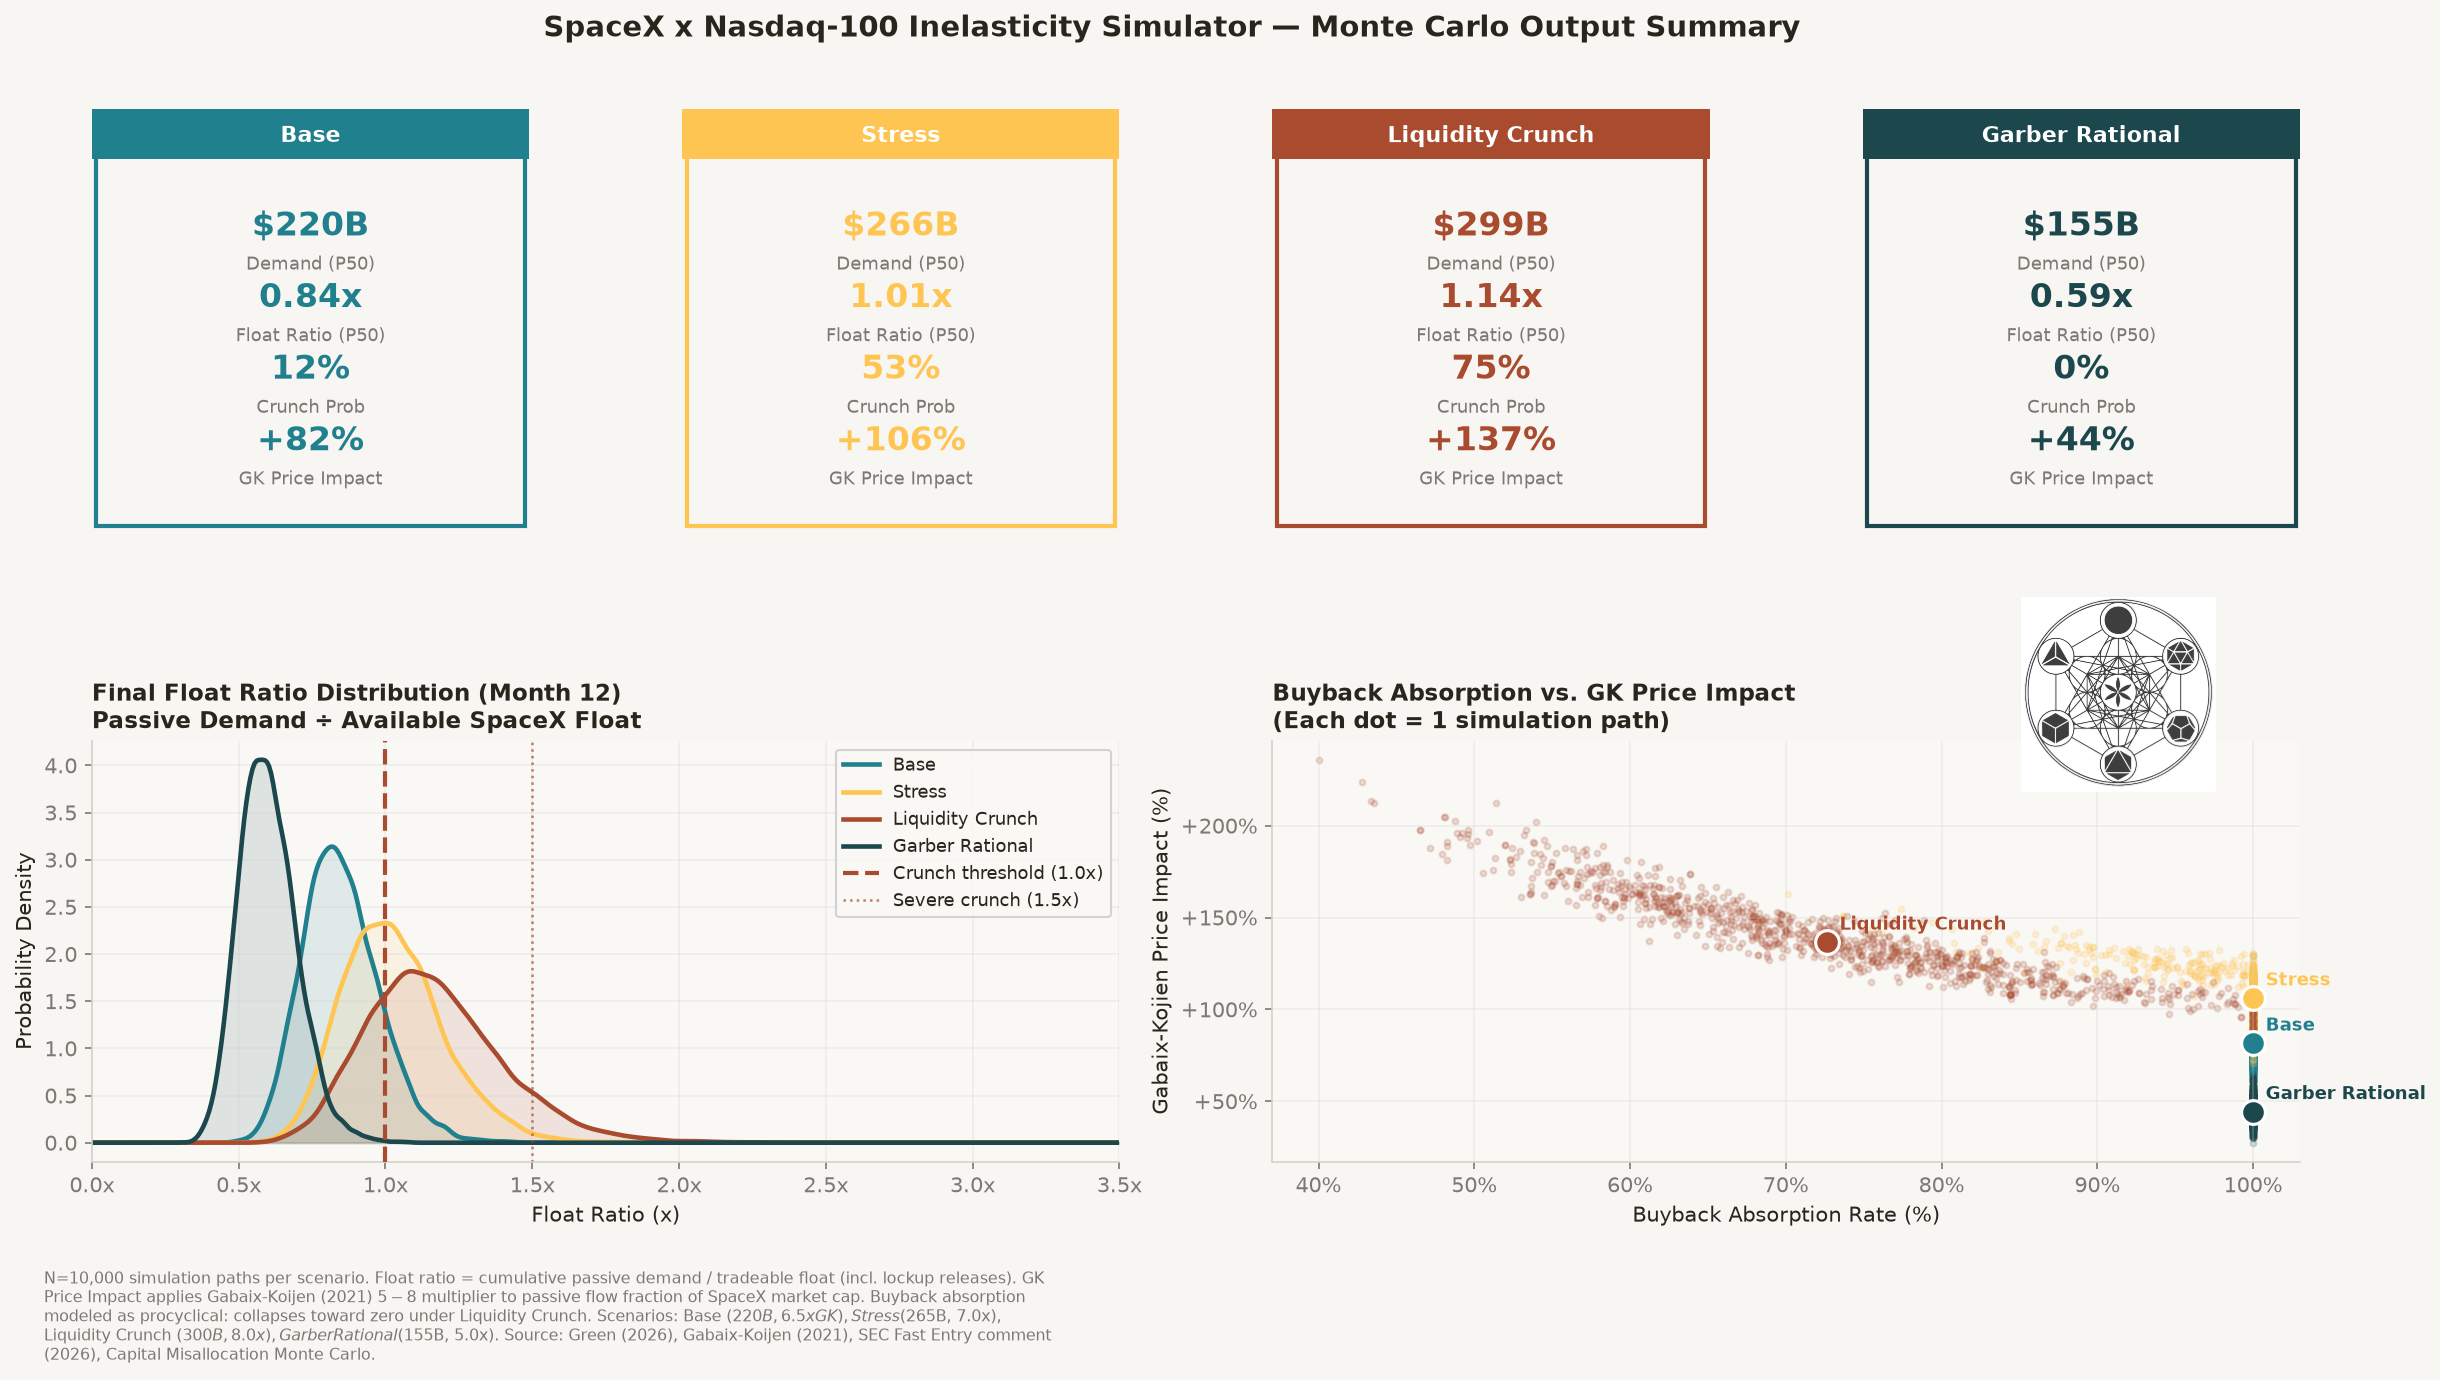
Figure B Buyback Absorption:
Buyback-generated supply against passive demand inflow under each scenario.
The base case puts crunch probability at 12%. Demand hits 0.84x of available float at peak. GK price impact runs to +82%. That is the optimistic read. The stress scenario puts crunch probability at 53%, demand/float at 1.01x, peak price impact at +106%. In the liquidity crunch scenario those numbers become 76%, 1.14x, and +137%. The Garber bull case sits at the other end: 0% crunch probability, demand/float at 0.59x, price impact of +44%.
Then the model produced something I did not expect to be honest.
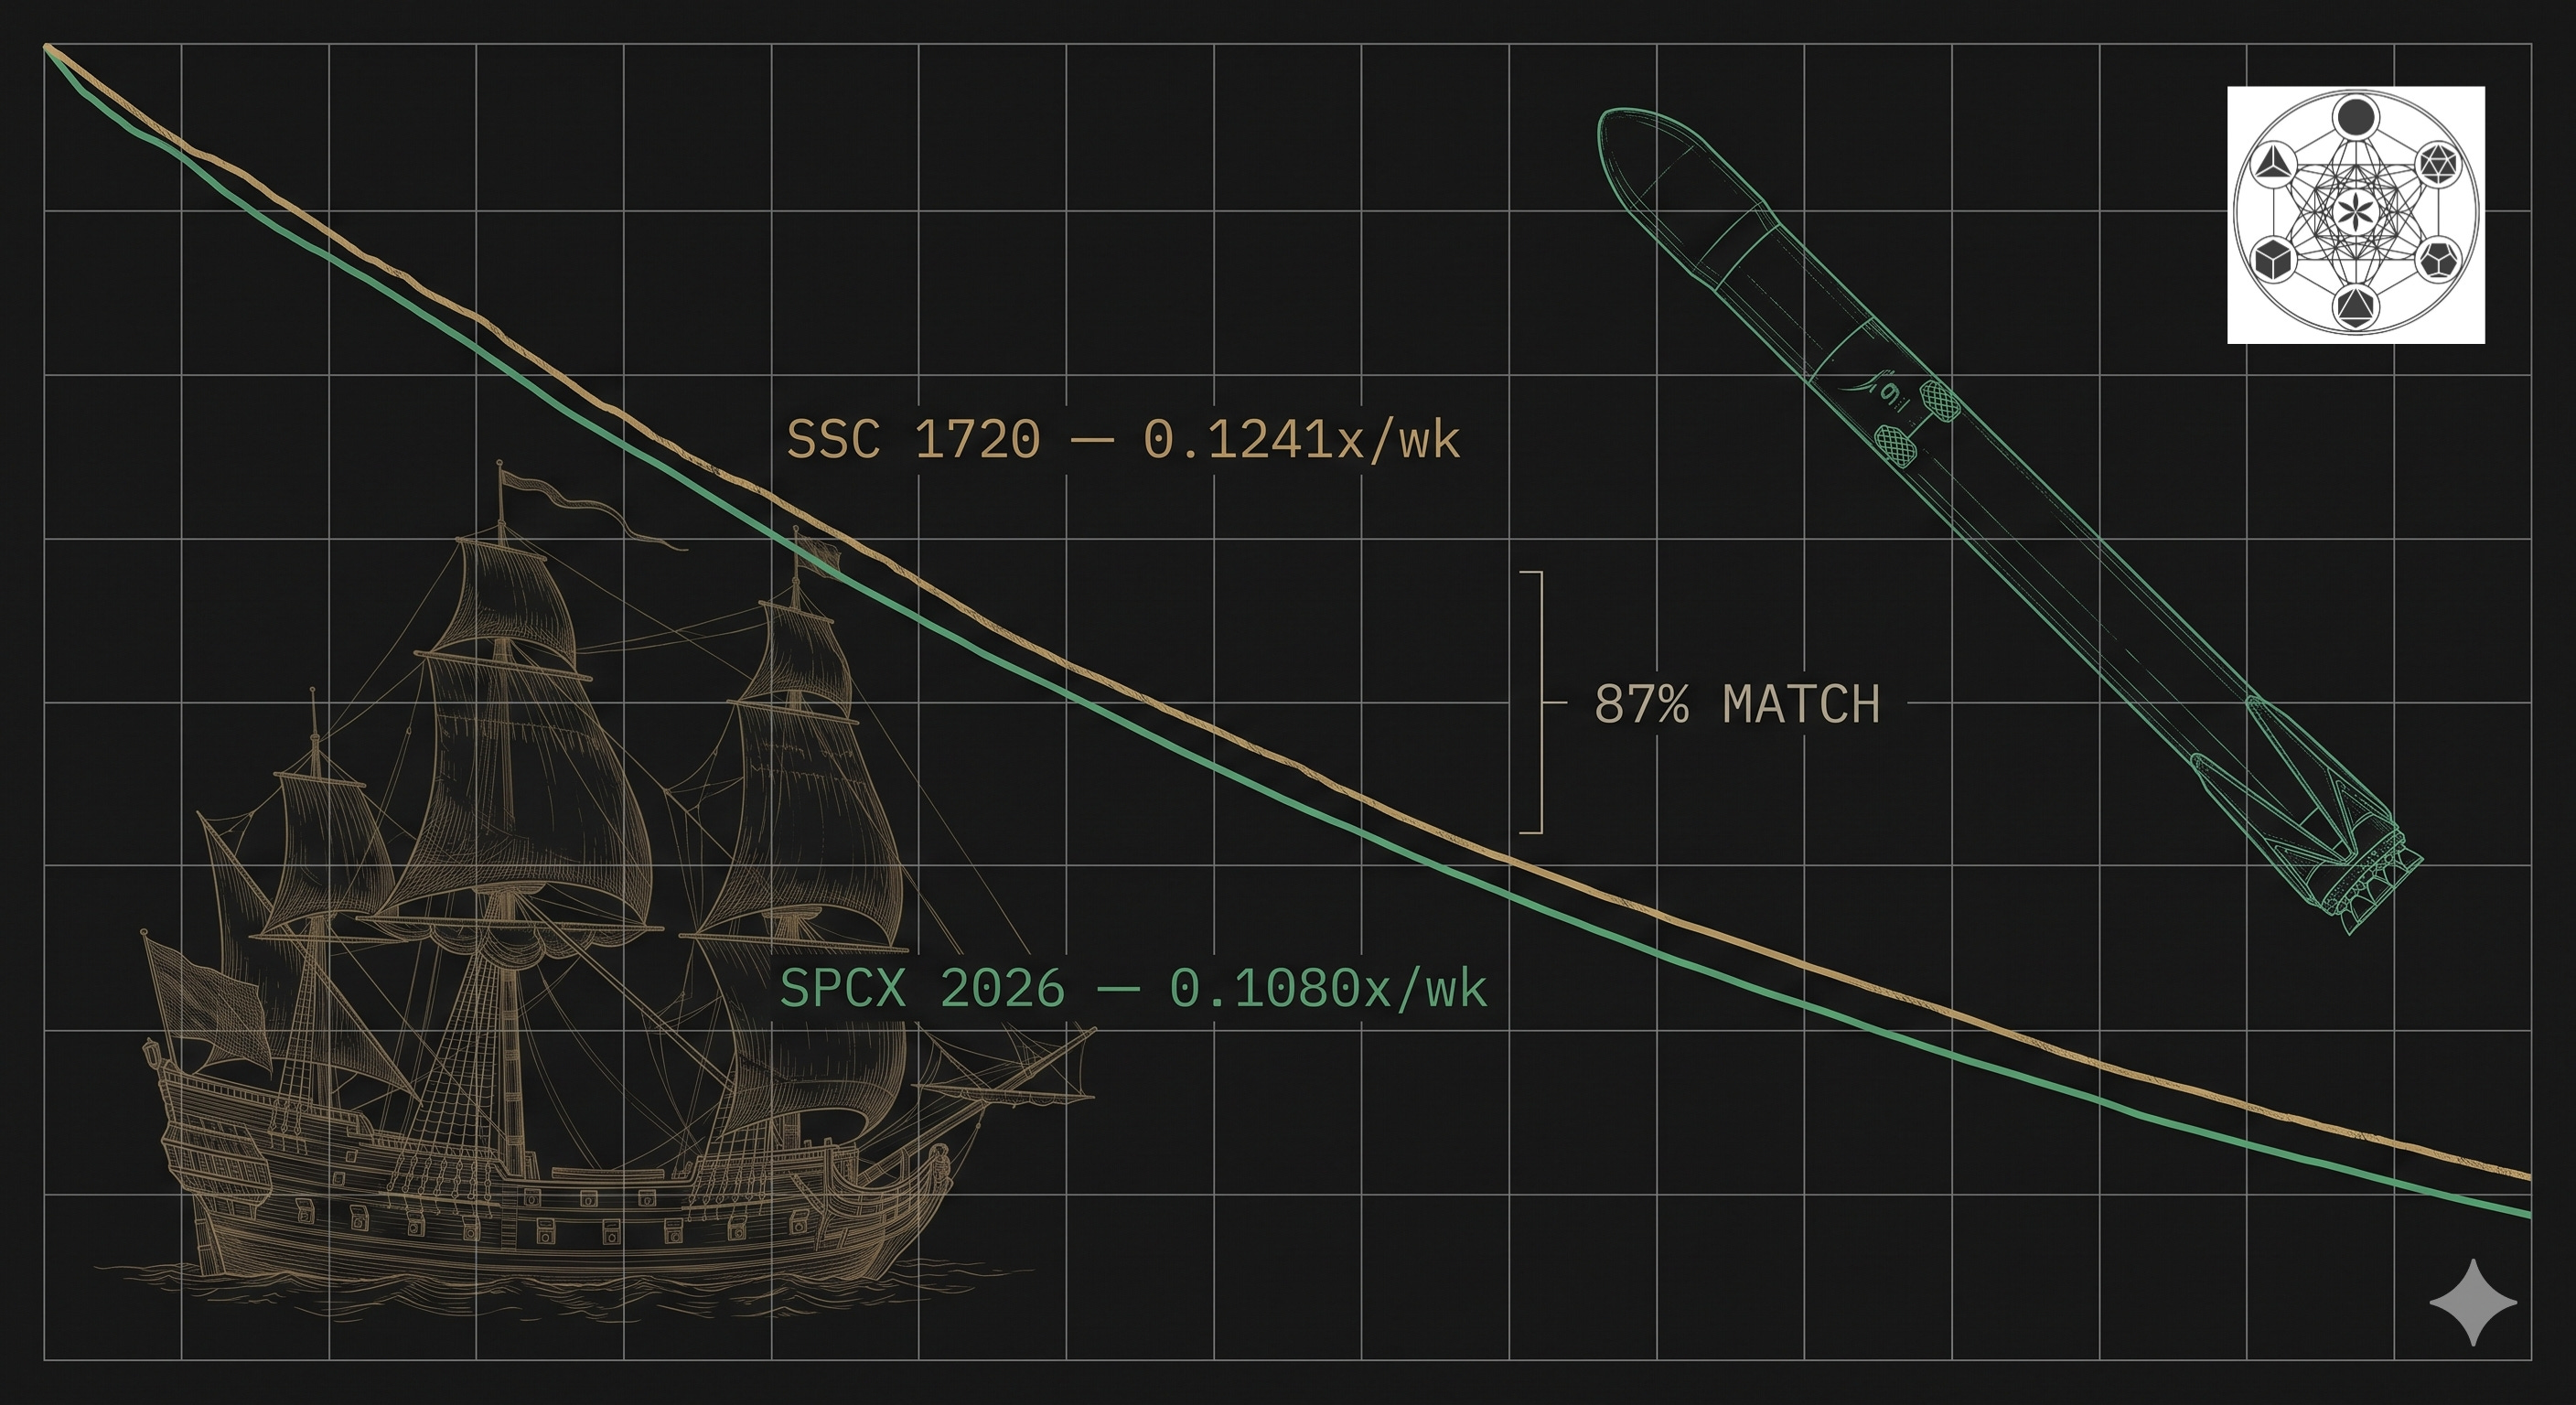
When you run the velocity comparison, the float depletion rate for the 1720 South Sea Company during the Subscription 1 and 2 phase (April 14 to late May 1720) was 0.124x per week. The 2026 liquidity crunch scenario generates a depletion rate of 0.1080x per week across months one through three post fast entry. That is an 87% structural match. Three hundred years apart with different instruments and markets. Yet, we find a similar rate of mechanical consumption.
Figure C Cumulative depletion paths:
Float depletion over the 12-month post-inclusion window under each scenario.
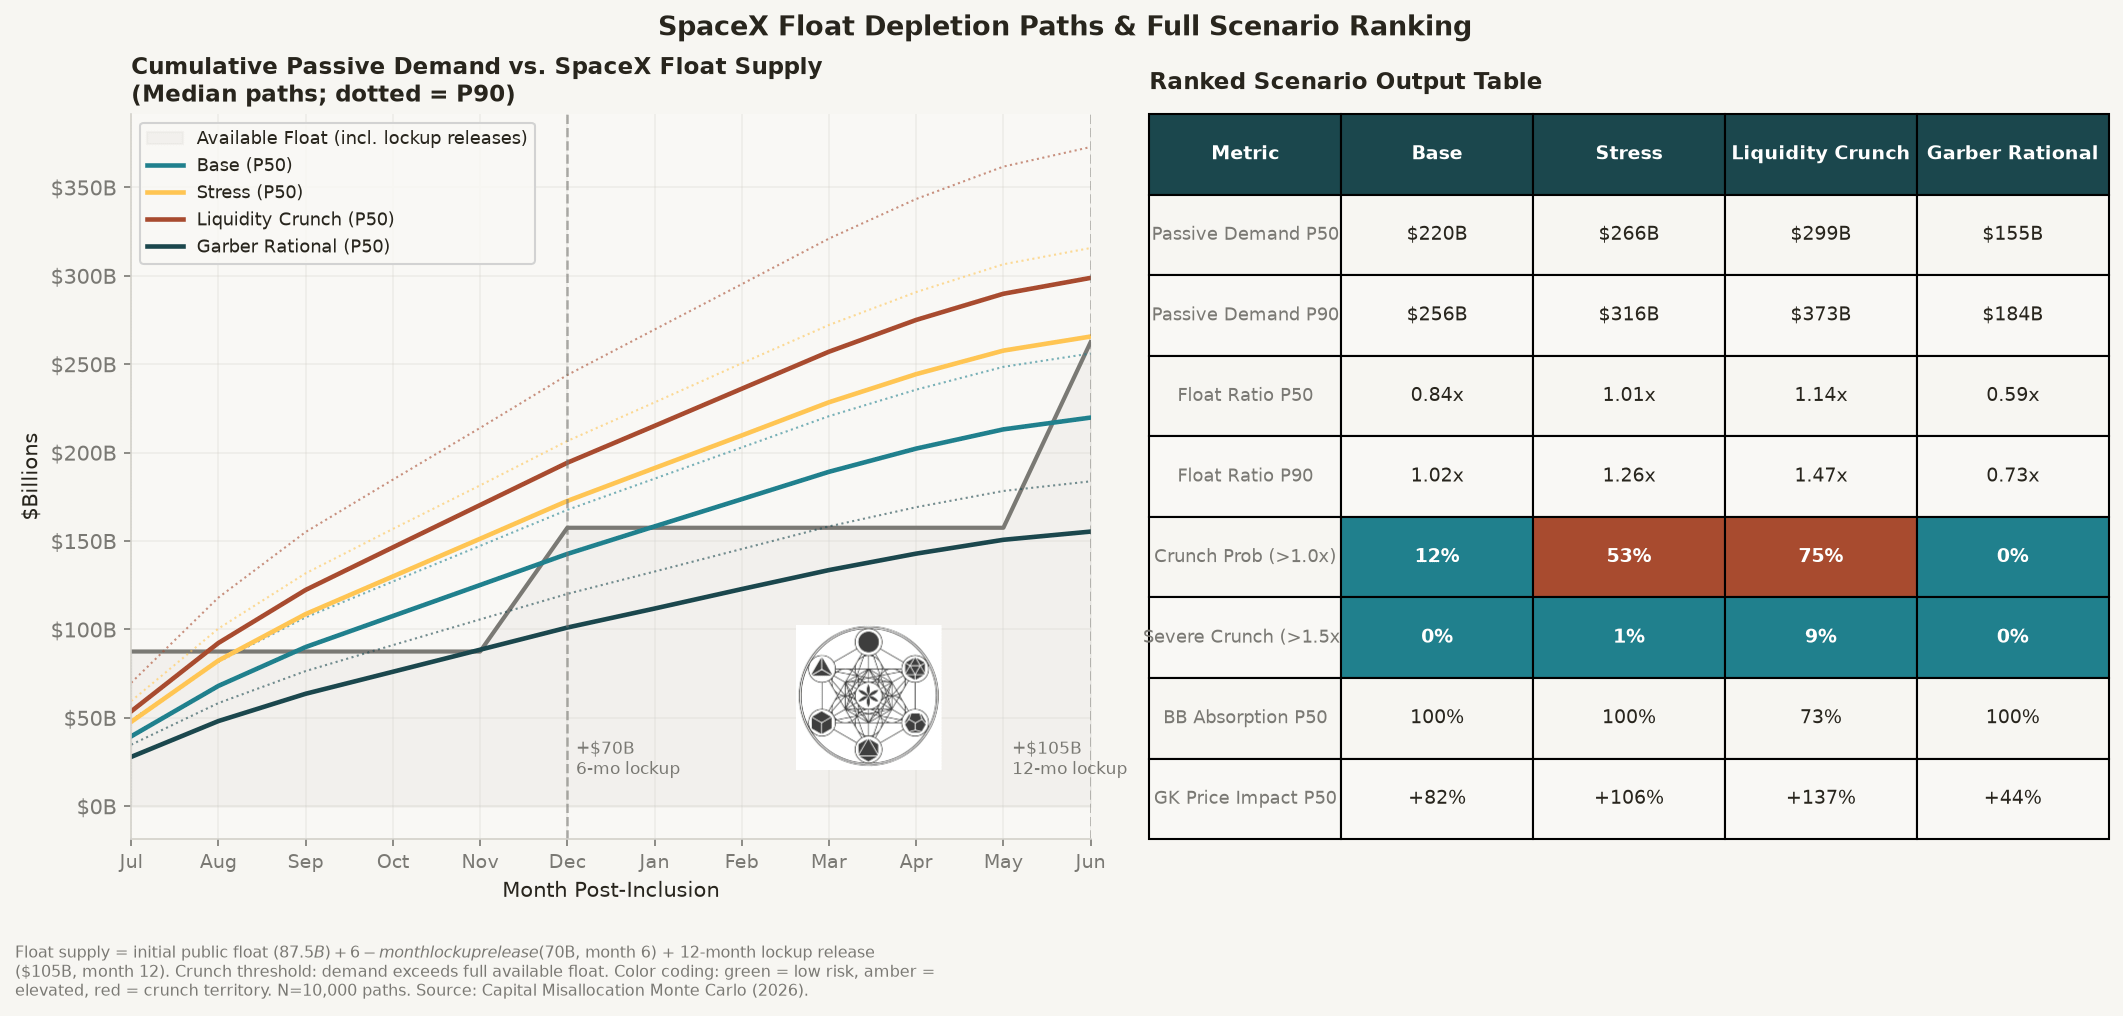
Figure D: SSC 1720 vs 2026 velocity comparison:
Float depletion rate match across 300 years of history.
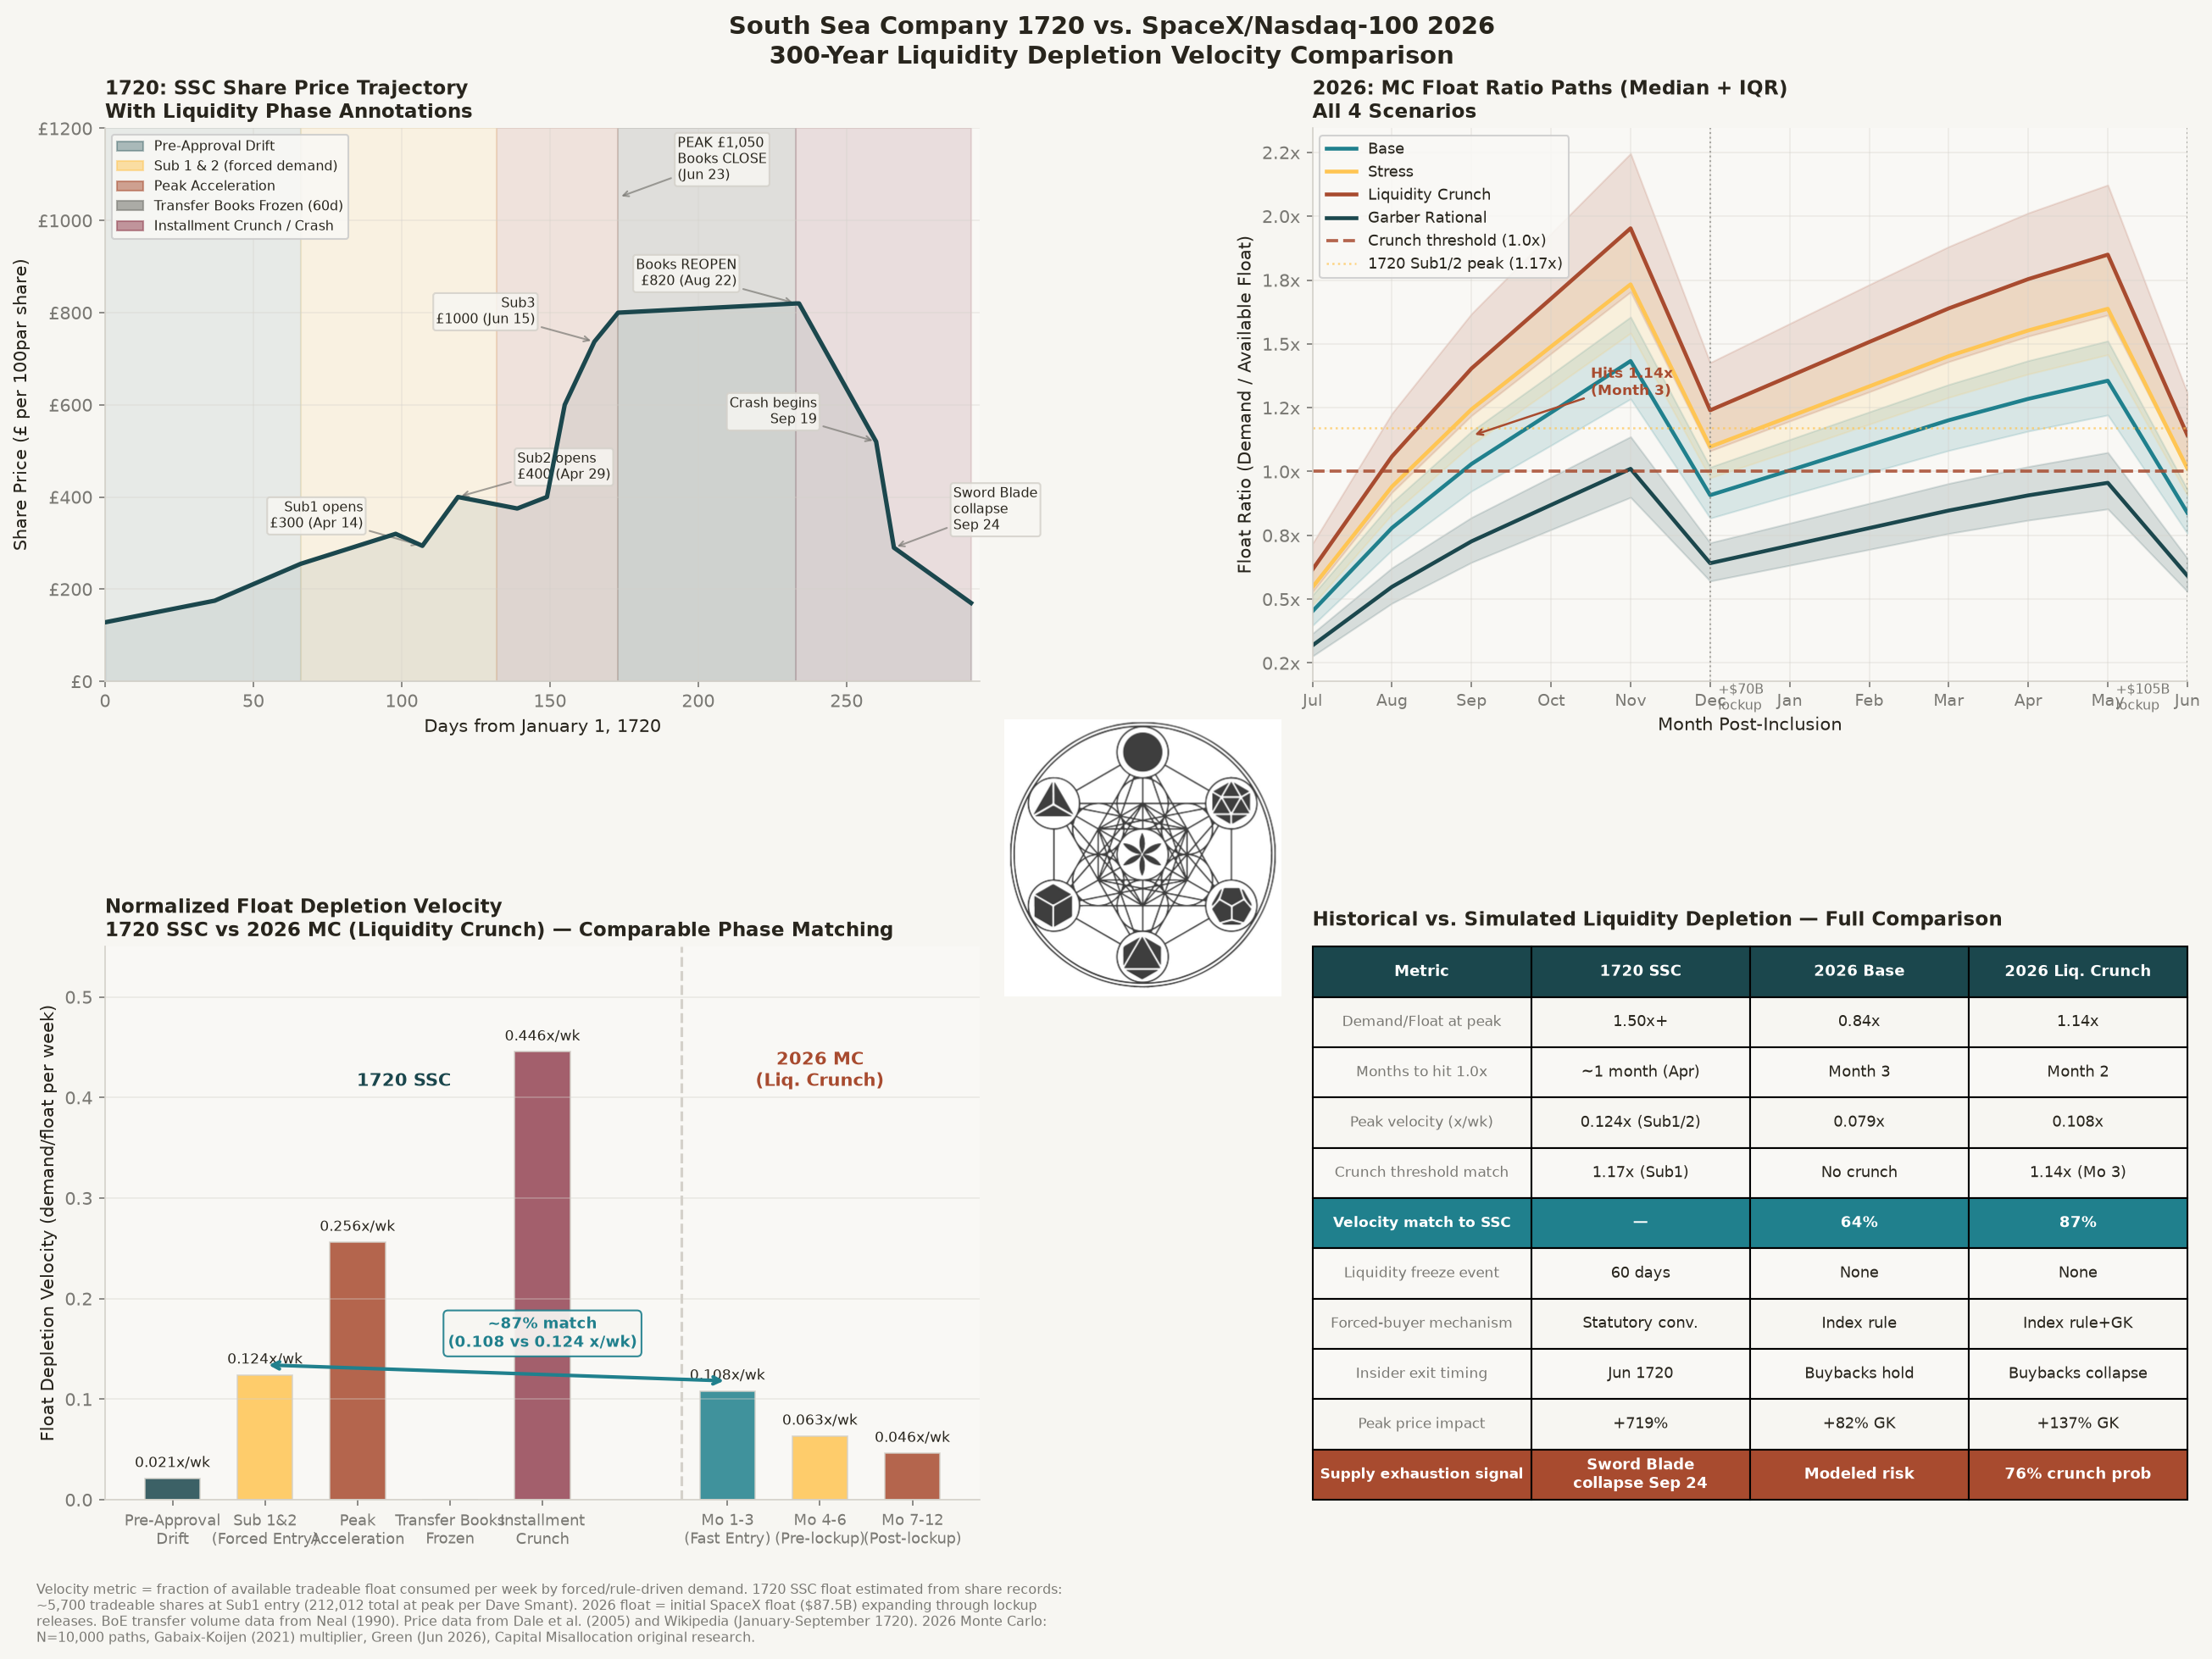
The 2026 version is actually more extreme as the ratio of Demand-to-Float peaks at 1.40x vs 1.17x in 1720.
There is one place where the 1720 episode had an accidental advantage. The South Sea Company closed its transfer books on June 23, 1720 and this meant that zero shares changed hands legally for 60 days.
The forward price peaked at £1,050 during that freeze. When the books reopened August 22, the spot price had already fallen to £820. It was not policy. It was a clerical pause that gave the market a moment to find itself. The 2026 version has nothing like it. Lockup releases in months six and twelve add supply ($70B and $105B respectively) but passive demand never stops. No pause. No price discovery window. The machine keeps running.
Figure F: Scenario KPI dashboard:
Full output across all four scenarios.
The Garber scenario is in the model. It is the 0% crunch path with the demand/float ratio at 0.59x, no structural break. While it is definitely possible, we will explore what you have to believe for it to be true in ACT 5 below.
ACT 5:
THE COUNTERARGUMENT
Peter Garber’s Famous First Bubbles (2000) is the best steel-man argument that I found while doing research and think it deserves an honest hearing.
Garber’s core argument: SSC prices in 1720 weren’t obviously irrational.
The SSC held a real monopoly on South American trade. Investors in early 1720 had legitimate uncertainty about the extent of that monopoly: Spanish ports could theoretically open, Latin American silver was a genuine prize, the upside scenario was not zero. On available information, the subscription prices reflected plausible expected values, not mass delusion. The bubble, on this reading, was less about irrationality than about negative information arriving at a moment when highly leveraged buyers couldn’t absorb the drawdown.
The modern equivalent writes itself: SpaceX has real revenue, genuine Starlink cash flows, a defensible monopoly on cheap orbital access. The performance bonus trigger ($175.50 for 5 of 10 days, hit four times as of June 23, 2026) reflects market participants pricing real operational milestones. Passive buyers forced in at current prices may be buying something legitimately worth the price. Garber’s framework allows for it.
But scrutinize the “real revenue” case for the broader AI complex in which SpaceX is now embedded, and the circularity is hard to ignore. I mean look no further than the fact that over 50% of Google’s GAAP profits in its most recent quarter were tied directly to the price appreciation of its investment in Anthropic, which was a one-time unrealized gain on which the market was placing a forward multiple. Approximately twelve percent of the S&P 500’s aggregate earnings in the trailing twelve months derived from similar cross-investment markups among mega-cap tech companies. When Nvidia uses its stock to invest in CoreWeave, and CoreWeave must use that capital to purchase Nvidia GPUs, the revenue is real in exactly the same sense that the SSC’s share price was real: it exists, but it is endogenous to the structure that created it. Garber’s rationality defense works better when the underlying revenue is exogenous to the financial architecture. In 1720 and in 2026, a meaningful fraction of it is not.
I discussed the circular funding dynamic present today in The New Mississippi a little deeper but I have incredible models built that look at the funding using agent based modeling and have built out a circuit of flows in essence. Anyway, I will get deeper into that down the road. I will add a few good decks and html on the topic that I have been working on lately below the paywall.
Add the buyback counterargument. Gabaix-Koijen assume some supply-side elasticity exists. If enough insiders sell into the passive bid, price finds a level. Buyback programs can serve the same function: companies repurchase shares when prices are low, issue when they’re high. Supply isn’t fixed.
Both arguments are real. Neither survives the Ergodic Lens.
Garber’s rationality case operates at the ensemble level. The question isn’t whether the average investor across all possible futures comes out whole; it’s whether any given investor, holding a non-repeatable positiob through the cycle, gets that average. Newton wasn’t irrational either. Dale et al. (2005) make that point explicitly: the SSC wasn’t obviously mispriced on ensemble metrics at elevated prices. Newton still lost £20,000. Ensemble rationality provides zero comfort to the individual non-ergodic investor.
The buyback elasticity argument is conditional and procyclical: available when it’s not needed, unavailable precisely when it is. S&P 500 buybacks collapsed in Q1 2020, Q4 2022, and every prior recessionary quarter. The supply response Gabaix-Koijen assume turns off at exactly the moment passive demand stops expanding, which is exactly when you need the offset.
And the float math doesn’t yield to buyback elasticity as passive demand is approximately 2x the available float at inception. You can’t repurchase your way out of a 2:1 demand-to-supply mismatch before the first insider can legally sell.
The SSC parallel sharpens here. During Subscriptions 1 and 2, the insiders (Blunt included) were selling. Supply was flowing. When Subscription 4 launched in mid-1720, the directors were largely out. What remained in the float was held by Op. 1 annuity holders (no exit, statutory conversion) and Op. 2 retail speculators (leveraged via Op. 3 SSC loans). The insiders had distributed. The forced buyers held the float.
Garber’s argument is elegant. Someone at the SSC investor relations desk was almost certainly making it in July 1720: trade monopoly upside, limited downside risk, diversified annuity holder base, management with demonstrated execution. By October the stock was at £170. Down 84% from the June peak. The argument for rationality at the ensemble level survived the crash entirely intact. It was of no use to the individual holders who couldn’t leave.
ACT 6
THE CLOSE: History Doesn’t Repeat, It Rhymes
Newton, after the collapse, reportedly said: “I can calculate the motions of heavenly bodies, but not the madness of people.” The attribution is widely repeated and not definitively sourceable; no contemporary record has been verified. Take it as attributed. The sentiment is accurate regardless.
The Bubble Act of 1720 is often described as regulatory reform after the fact. The timing is more precise: the Act passed in June 1720, during the mania, before the September collapse. It banned all joint-stock companies from operating without a royal charter, eliminating the SSC’s competitors while the SSC itself remained chartered and operating. Not an unwinding of the conversion. Not compensation for the annuity holders, statutorily converted into shareholders, who watched their position fall 84%. Not an audit of the directors’ exit timing. A law that protected the monopoly while it still had value, framed as public protection, passed while the architects were still in position.
Three hundred years later and the architecture most definitely rhymes. The SEC Fast Entry comment period for SR-NASDAQ-2026-004 is open. The best comment on file argues the rule “creates incentives for index inclusion strategies that may not align with long-term market quality.” A formulation that carefully survives a lot of future hearings.
The architects of the current structure are still holding their positions while the comment letters accumulate. The regulatory intervention, as in 1720, protects the mechanism while the mechanism is still running.
Newton thought he owned a share of British commerce. He owned a conversion formula.
Your 401(k) thinks it owns the Nasdaq-100. It owns a fire hose pointed at a float that was never designed to absorb it.
Cheers,
Benny
NOTE - EXTRA MATERIALS BELOW PAYWALL
If interested please consider becoming a free or paid subscriber. The accompanying slide decks on the topics discussed (Ergodicity Economics, AI Circular Financing, Mike Green Mechanics Recursive Analysis, Inelastic Market Hypothesis, and The South Sea Machine) are all included below the paywall. In addition, I run a private Whatsapp chat channel that has many large traders, portfolio managers, public finance figures, and successful investors in it alongside paying subs as well as some of my LPs. It operates as a channel for me to share my research, daily market information flow, a detailed morning note, and often has the participants share their thoughts as well. Think of it as a digital clubhouse for high level market participants and if you are interested you can join until I reach the Zuckerberg induced cap of 200 members so grab your spot.
Subscribe to Capital Misallocation
Sources:
Peter Garber, “Famous First Bubbles” (2000).
Neal, L. “The Rise of Financial Capitalism” (1990).
Dale, Johnson & Sprague (2005), “Evidence of Irrational Behaviour During the South Sea Bubble,” The Economic History Review (PDF).
Temin & Voth (2004), “Riding the South Sea Bubble,” (PDF).
Frehen et al. (NBER w15332), “New Evidence on the First Financial Bubble” (PDF).
Neal, L. “The Micro-Foundations of the Early London Capital Market.” 1990. PDF (BoE transfer volume data, Table 1 — basis for Figure D velocity series)
CDMA Working Paper Series, University of St Andrews (2007). PDF (SSC subscription shares as % of total float — 10–15% estimate)
Smant, D. “South Sea Bubble 1720.” Link (Total shares outstanding: 212,012; peak market cap £164M)
Gabaix & Koijen, “In Search of the Origins of Financial Fluctuations: The Inelastic Markets Hypothesis”.
Mike Green, Excess Returns Podcast (June 2026): full transcript. SEC comment SR-NASDAQ-2026-004: filing. SpaceX 424B4 Prospectus, June 12, 2026.
Ole Peters, “Ergodicity Economics,” Nature Physics (2019). Nasdaq-100 Index Methodology Update, effective May 1, 2026.
Michael Green, Hari P. Krishnan & Stephan Sturm, “A Model for Passive That Breaks the Market” (March 2026), circulating on SSRN.
Michael Green / Logica Capital Advisers, “Policy in a World of Pandemics, Social Media and Passive Investing” (2020).
Lasse Heje Pedersen, “Sharpening the Arithmetic of Active Management,” Financial Analysts Journal (2018).
Capital Misallocation, Monte Carlo Simulation Analysis (June 2026), N=10,000.
Image credits:
1. Hogarth engraving: public domain, Wikimedia Commons / Metropolitan Museum of Art.
2. Newton portrait: National Portrait Gallery, London (public domain). SpaceX launch: John Kraus / National Geographic. Nasdaq MarketSite: Nasdaq.com.
3. South Sea Stock Bubble Chart: Marc Faber, Author of Gloom, Boom, & Doom Report.
Keep reading with a 7-day free trial
Subscribe to Capital Misallocation to keep reading this post and get 7 days of free access to the full post archives.