
The Compute Standard
Japan never paid for 1989. It refinanced for 36 years. The AI credit stack is the new invoice.

Capital Misallocation™ · Essay #4
The 4th of 50 essays on Capital Misallocation™. The Mississippi essay was about how Systems form. The South Sea essay was about how forced buying works. The Railway Hallucination was about what happens after: the technology wins, the infrastructure survives, the investors get destroyed. This one is about what happens before. The deferral of a bill for thirty-six years. The refinancing vehicle that warehoused it. And the moment that vehicle starts lending into the next boom.
The episode du jour is the Japanese Bubble of the 1980s. One that deferred the total cost of the bill for 36 years, and whose ghosts may reappear today to end this GPU episode.
Prologue: The Bank That Lent Against the Land, Now Lends Against the Machines
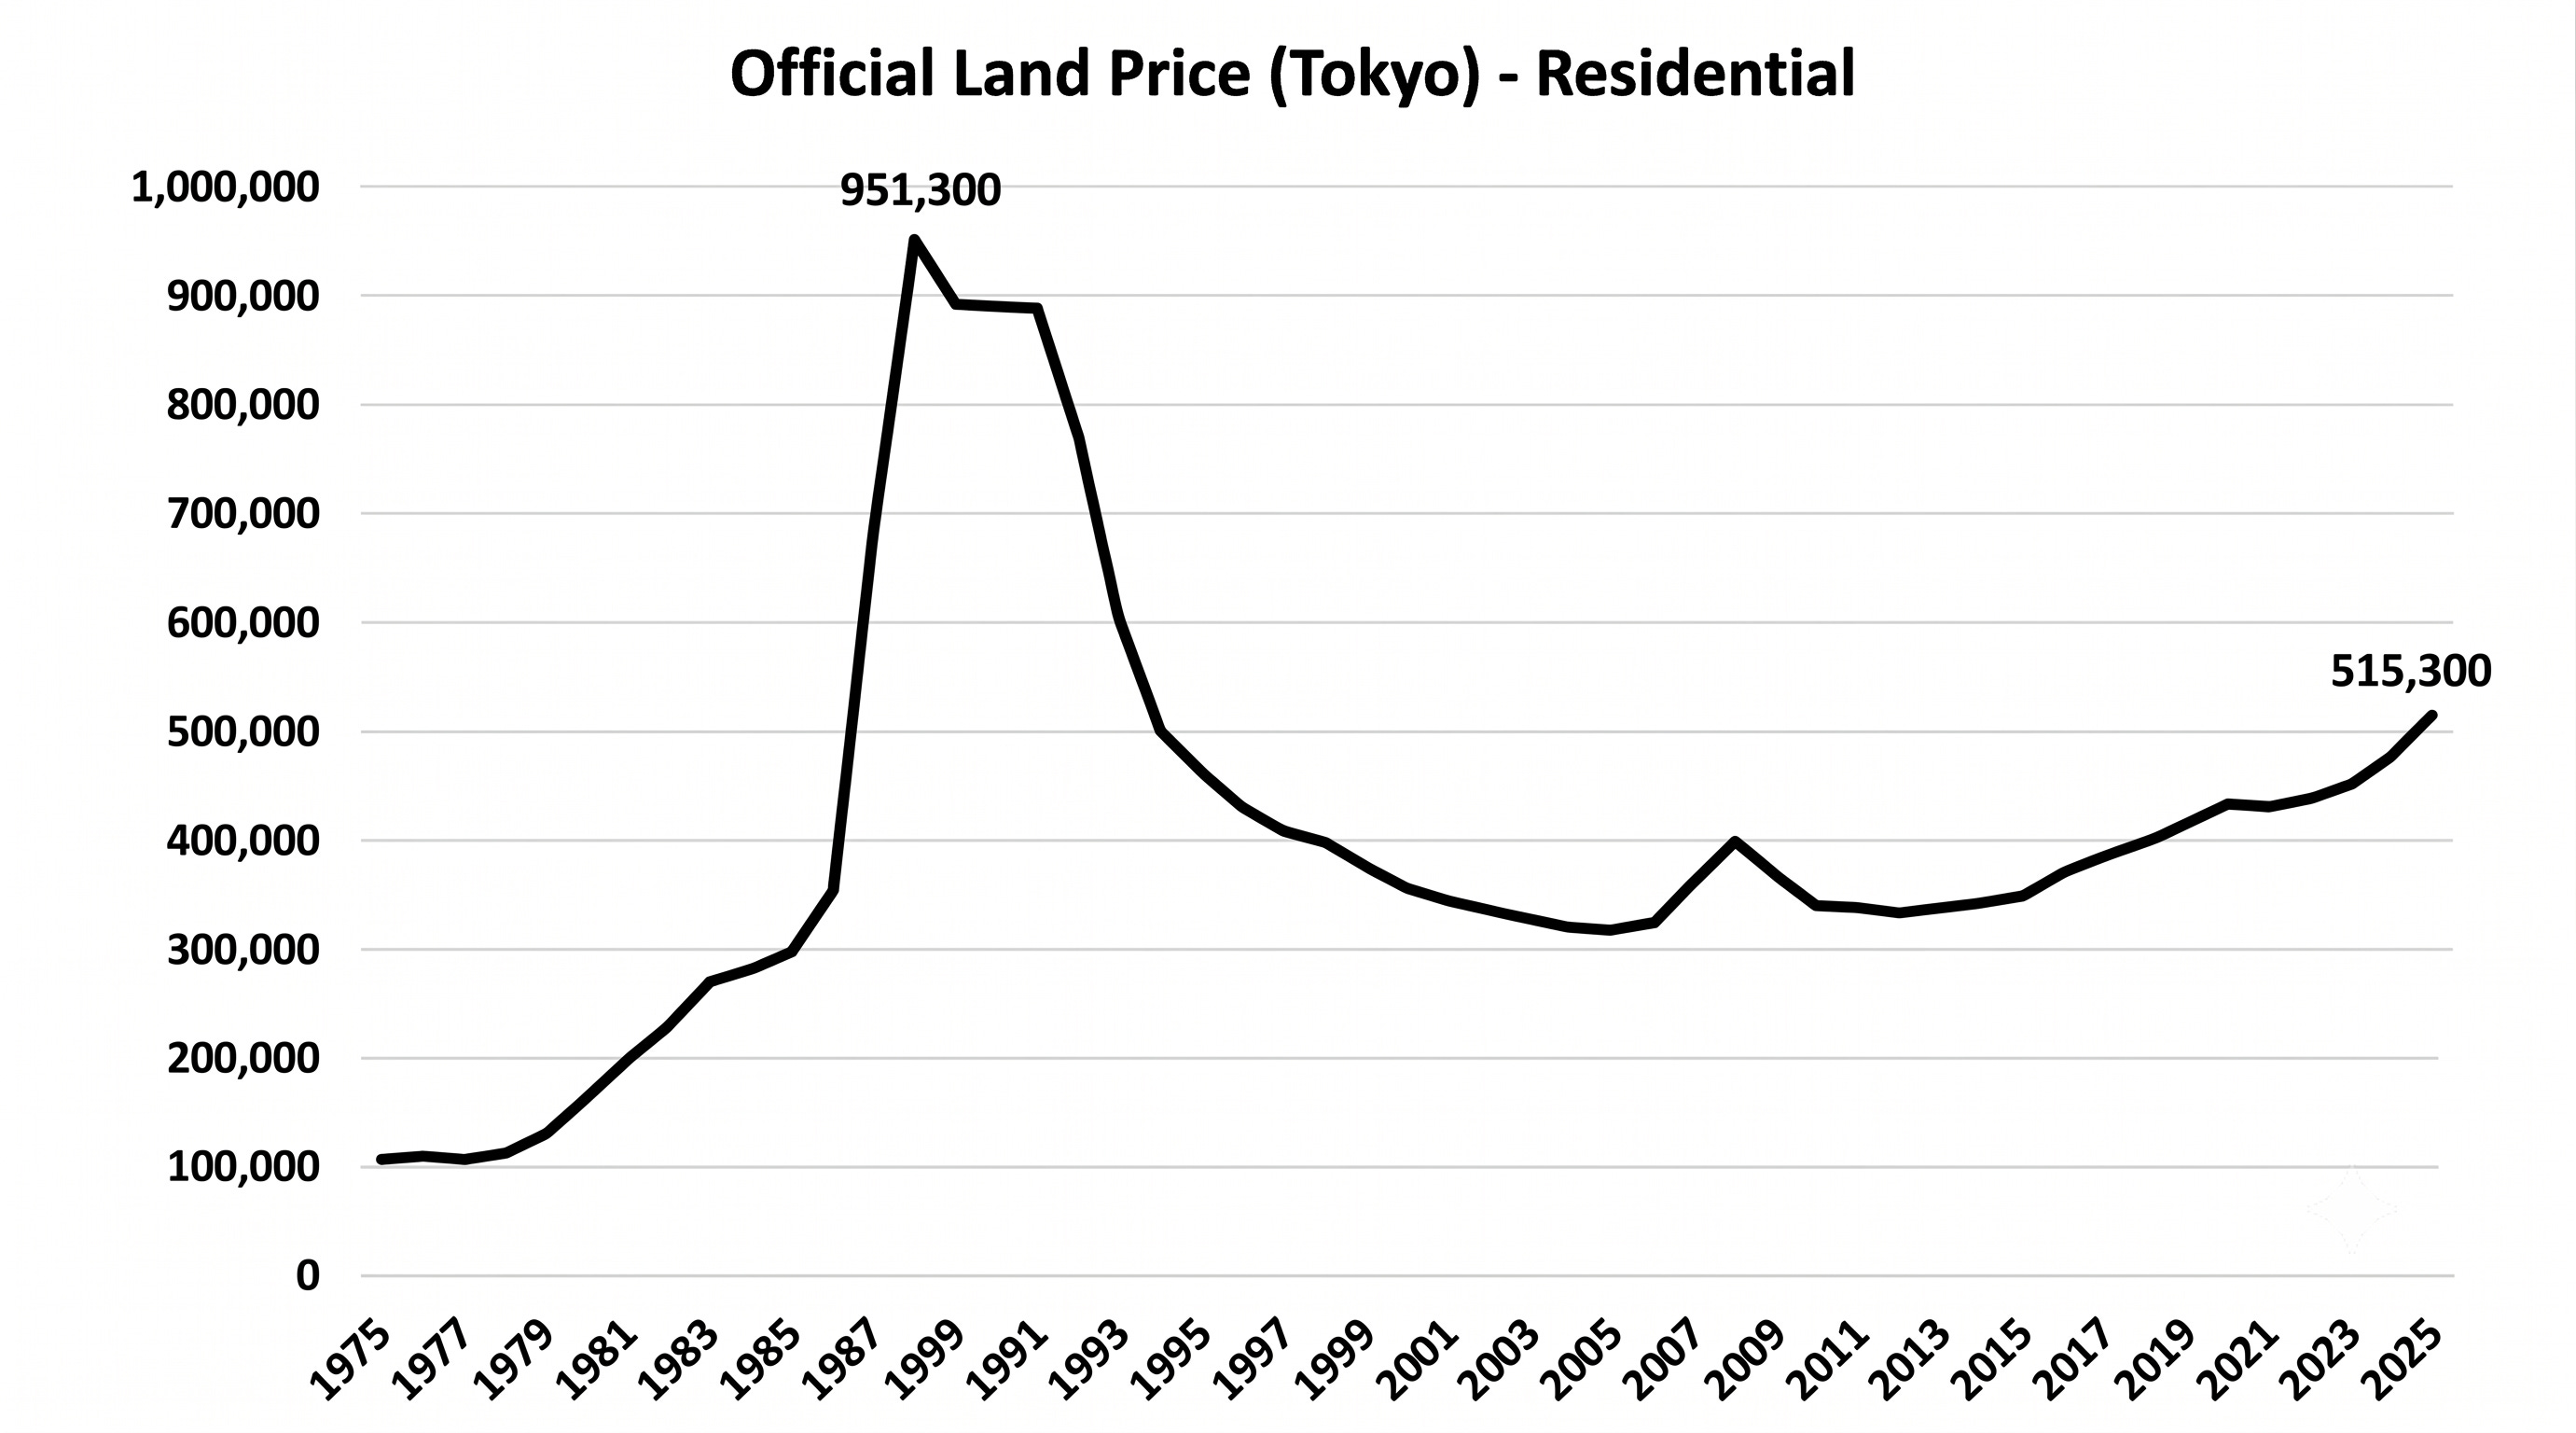
At the peak of the 1980s Japan Bubble, the pavement in front of the Kyukyodo stationery store in Ginza was assessed at ¥36.5 million per square meter. That works out to roughly $287,000 for a patch of ground about the size of a bath mat. The grounds of Japan’s Imperial Palace were valued at a notional amount that made them worth more than every building and acre in California [1] [2].
The engine that drove that mania was not the price. It was the lending.
Japanese banks operated on what economists called tochi hon’i sei, or as it is commonly referred to in the west, simply the land standard. Banks created credit against the collateral of land whose value was assumed never to fall [3]. If that sounds eerily familiar to you readers who remember the GFC, don’t fret. After all this research on historical episodes of Capital Misallocation™, I have concluded that there is ALWAYS a premise that is taken as a given, as it was in math class growing up, that serves as the cornerstone foundation underlying bubbles.
At the peak, roughly 44% of all secured bank loans in Japan were collateralized by land. Compare that absurd number against an estimated 8% of loans collateralized by financial assets [4]. At that moment in space time, the Japanese banking system had made a single, undiversified bet on one asset class, and called it prudence.
Mitsubishi Bank, the perceived “disciplined” core of the Mitsubishi keiretsu, was a central lender throughout that boom period. To quote its own official history, it “escaped the troubles relatively unscathed because of prudence and caution” at the same time its rivals drowned [5]. Mitsubishi survived, absorbed the Bank of Tokyo in 1996, swallowed UFJ in 2005, and emerged as MUFG. Japan’s largest bank, assembled from the debris of the bubble it had helped inflate.

On July 17, 2026, roughly 36 years after the peak of the land standard, MUFG served as structuring agent, sole bookrunner, and underwriter for a $775 million senior secured facility for Nebius Group (NBIS), a neocloud company that is a rival of CoreWeave (CRWV), my favorite equity and credit short in the market today since late May. The MUFG/Nebius deal was signed on July 10 and priced at SOFR plus 250bps. The loan matures in October 2030, carries a minimum debt service coverage covenant of 1.15x, and is (obviously) ring-fenced inside numerous non-recourse special purpose vehicles. The collateral underlying the deal was not land in Marunouchi. The underlying asset of today was deployed GPU infrastructure and contracted cash flows on that silicon [6].
Let’s rewind back to the recent local low in the markets on March 30th, 2026. On a day that most market participants were begging for a Trump Enchilada, MUFG, the same bank that was central in fueling the 1980s Japanese bubble, served as a co-structuring agent and joint bookrunner on CoreWeave’s $8.5 billion facility, the first GPU-backed financing ever to carry an investment grade rating [7].
The collateral has changed but the loan officer’s faith hasn’t.
Japan’s megabanks have not merely observed the AI build-out. They are, once again, the collateral lenders fueling the boom.
This time the collateral is silicon.
The cost of the 1980s Japan bubble was never fully paid. I would argue that the tab was in fact refinanced across almost four decades, right up to today’s market that features the beachball (Yen) emulating a 2021 crypto chart since its bottom 15 years ago, with occasional sharp reversals as we have seen this week since Warsh disappointed dollar bears and hawkish speculators. The first deferral of the bill came through the banks, then the central bank, and then the state itself. Not unlike our experience here in America on a time lag. The entity doing the refinancing has now come full circle, lending into the very boom that Japan’s own monetary normalization threatens to unwind.
What follows traces the full credit circuit.
Act I covers how the bubble bill was deferred after the crash.
Acts II and III cover how that hole is still being re-invoiced today.
Acts IV and V cover why the AI build-out sits on the other side of the ledger.
Act VI examines the CMSS score against historical episodes and what the final accounting could look like.
ACT I: THE DEFERRED BILL
Two Peaks, One Debt
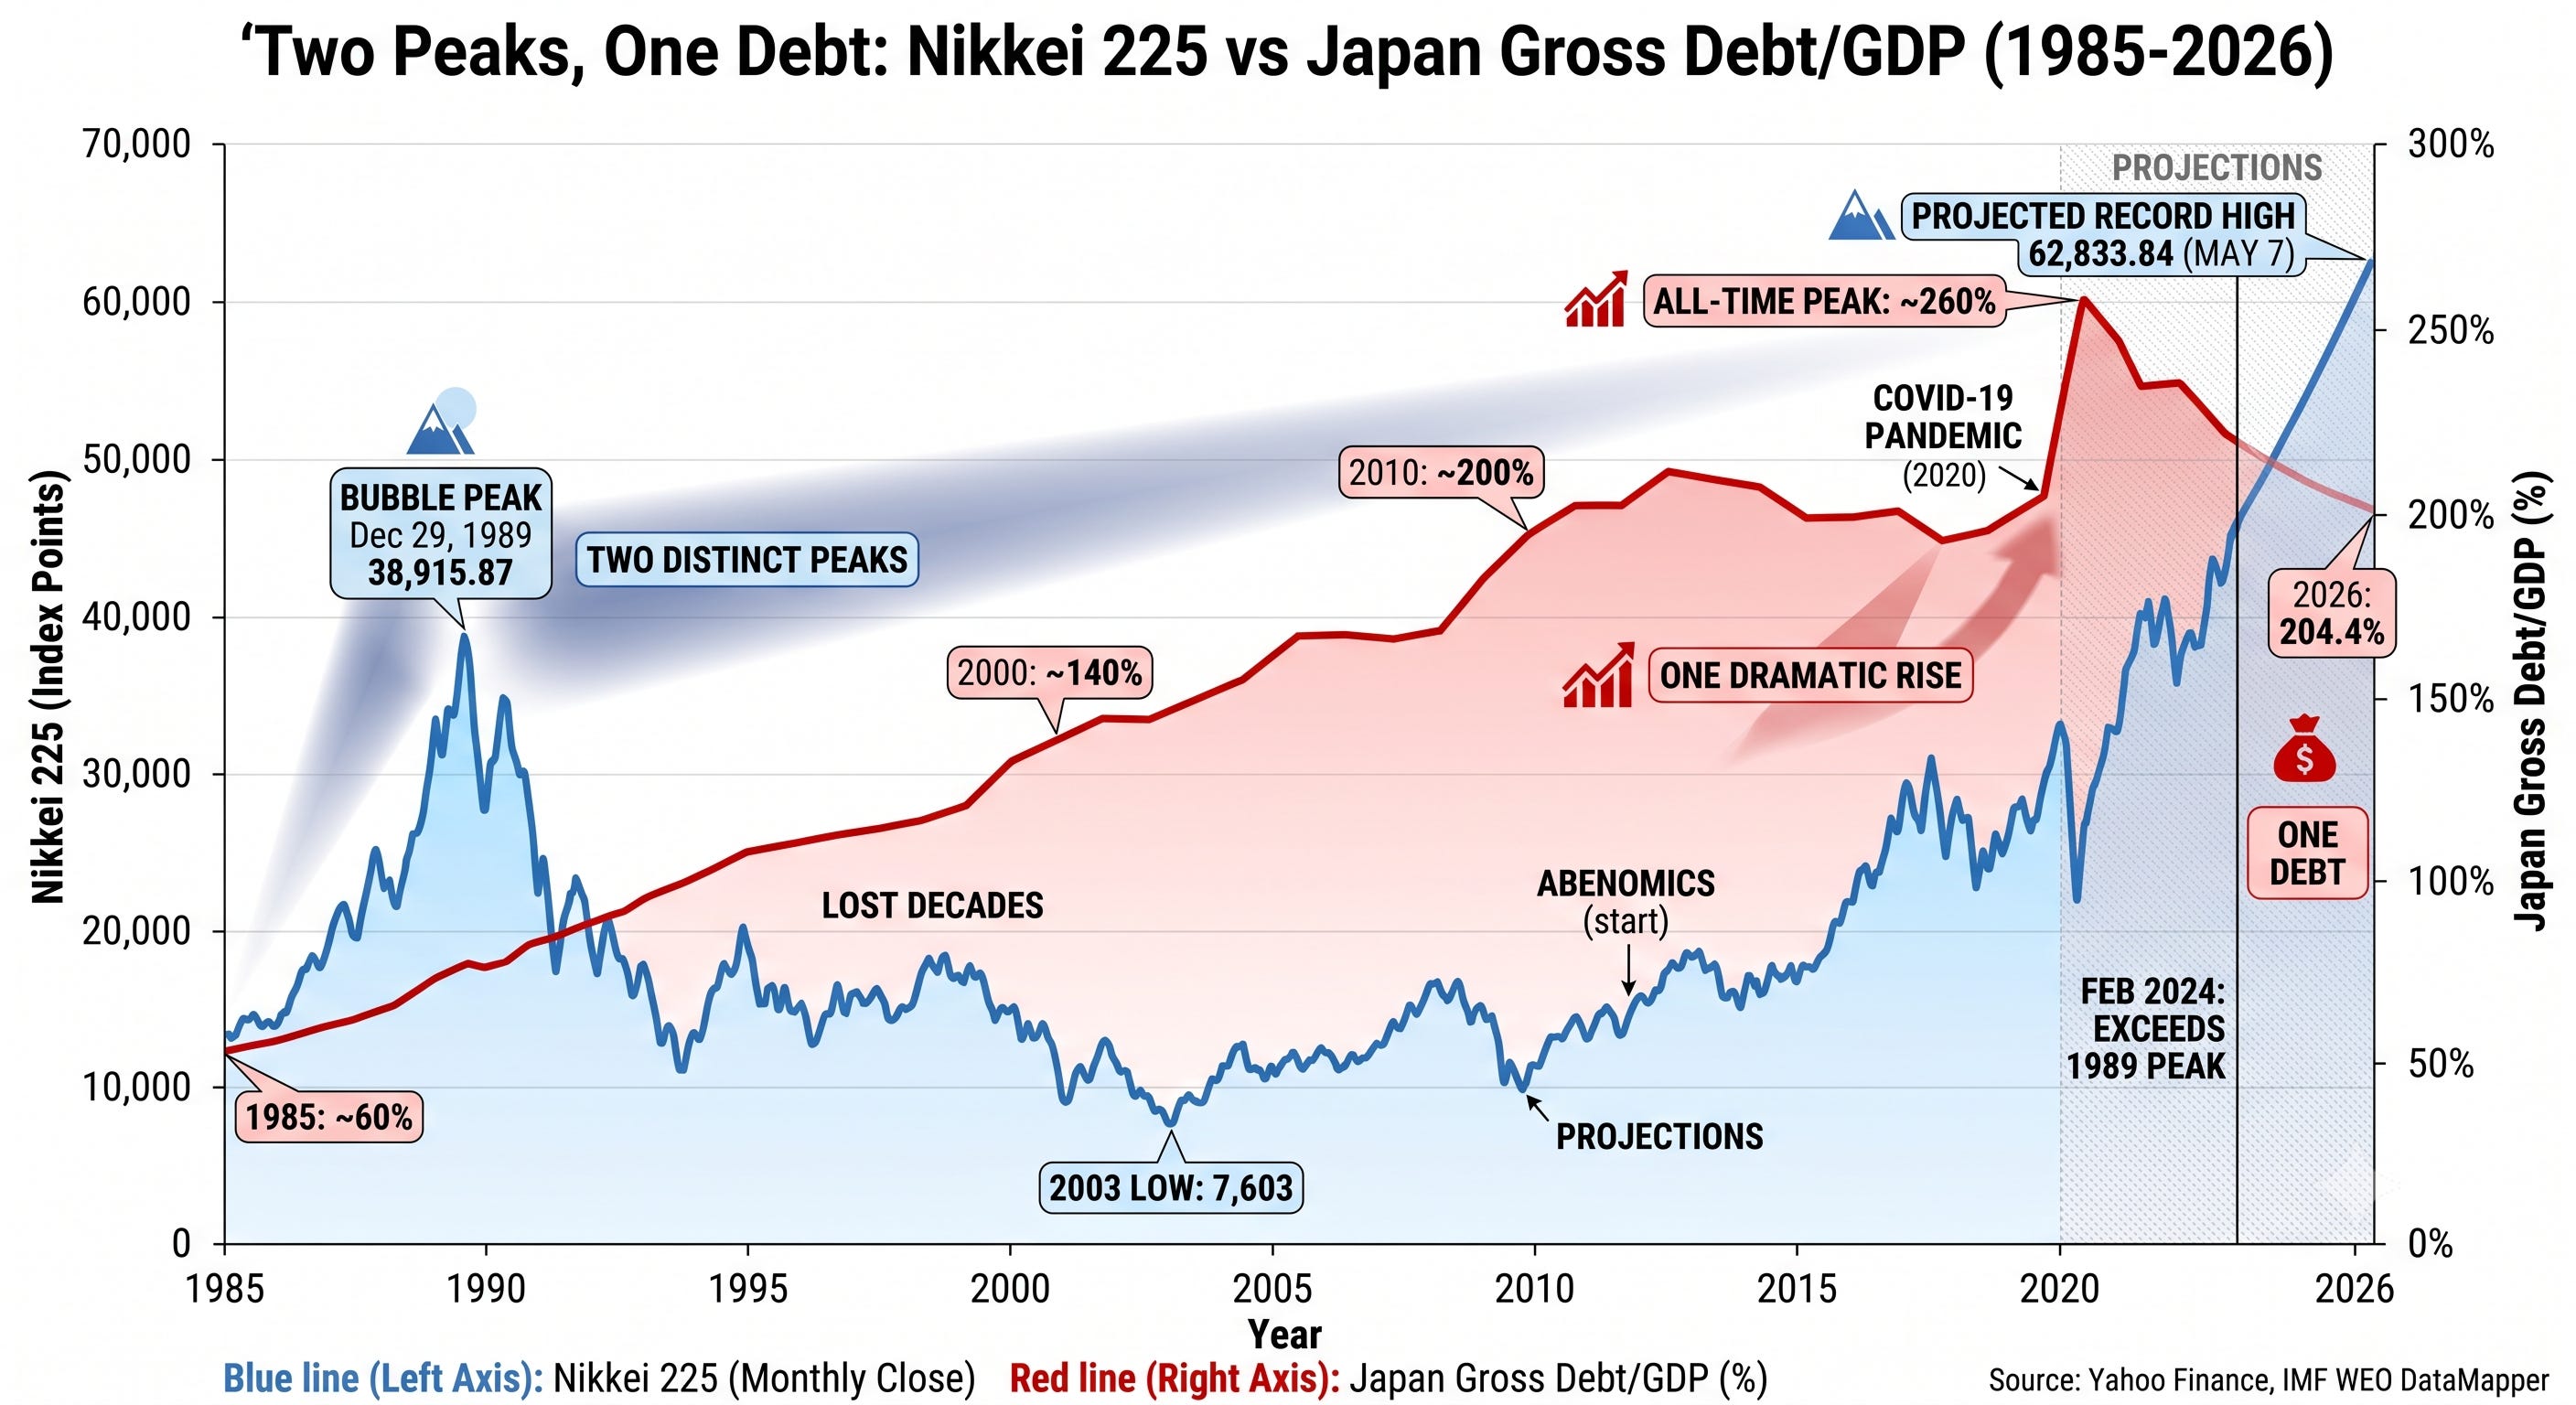
The Nikkei 225 index has gone on what Jerry Garcia might refer to as a long strange journey over the past 40 years. The national equity index has made a full round trip from the vertical ascent into its bubble peak level of 38,957 on December 29th, 1989 (closing basis). The time in between featured the long grinding collapse of 82% to a post-bubble low of 6,994 reached 19 years after the peak on October 28, 2008. There were many false dawns along the way that crushed so many value oriented PMs over the years.
Then the second act of the Nikkei began with Shinzo Abe and Abenomics in 2011. As a side note, that was the moment your author switched his macro view that was previously negative USD, negative US equities, and bullish gold and commodities. It was clear to me at the time that it was time to get bullish on the USD and US stocks, a very non-consensus view back then. I would go around to banks’ breakfasts and lunches just to argue with their way too bearish strategists about what I viewed as the largest macro shift that no one was paying enough attention to.
On February 22, 2024, the Nikkei reclaimed its 1989 high at 39,098. Since then the Japanese index nearly doubled to new record highs of 72,831 on June 22nd last month, before shedding roughly 17% in the vicious July correction we witnessed, with the low coming on Wednesday this week [8] [9].
In 1989, four of the five largest companies on Earth by market capitalization were Japanese banks. Industrial Bank of Japan at $104 billion, Sumitomo Bank at $73 billion, Fuji Bank at $69 billion, and Dai-Ichi Kangyo Bank at roughly $60 billion, with only Exxon breaking the sweep [10]. The Nikkei itself closed out 1989 trading at a P/E ratio of roughly 75x carrying a dividend yield of 0.3% [11]. A real bargain valuation.
Every one of those four banks is gone today as an independent institution. They were absorbed into the same megabank consolidation (Mizuho, SMFG, MUFG) that produced the MUFG desk now underwriting Nebius. There were approximately 21 major financial institutions in Japan as we rode into the 1990s, with only three coming out the other side. The Bank for International Settlements reported that 110 deposit-taking institutions were dissolved under the deposit insurance system. Total resources absorbed in dealing with non-performing loans from April 1992 to March 2000 reached ¥86 trillion, or 17% of GDP, combining bank charge-offs and provisioning, Deposit Insurance Corporation transfers, and capital injections [12].
In 1990, Japan’s general government gross debt stood at approximately 55% of GDP, mid-pack amongst the advanced economies of the world. By 2000 it was 118%, only to reach 179% in 2010 and then peak at 229% during the pandemic of 2020. It has deleveraged some since and now stands at roughly 204% gross today [13].
As private asset values collapsed, the equity losses did not vanish, as they never do. Instead, those losses methodically migrated onto the public balance sheet over the subsequent three decades.
The Nikkei’s recovery was, in an accounting sense, financed by the state.
A Necessary Refinement
The headline gross debt figure overstates the net burden. On a net basis Japan’s debt is closer to 150% of GDP once government financial assets are counted, and roughly half of the JGB stock is held by the Bank of Japan, meaning it is money owed by the state to itself, no different than the Social Security trust’s holdings of US Treasuries [13] [14]. That is why the crisis never arrived on the schedule the doomsayers kept publishing throughout the 1990s and beyond.
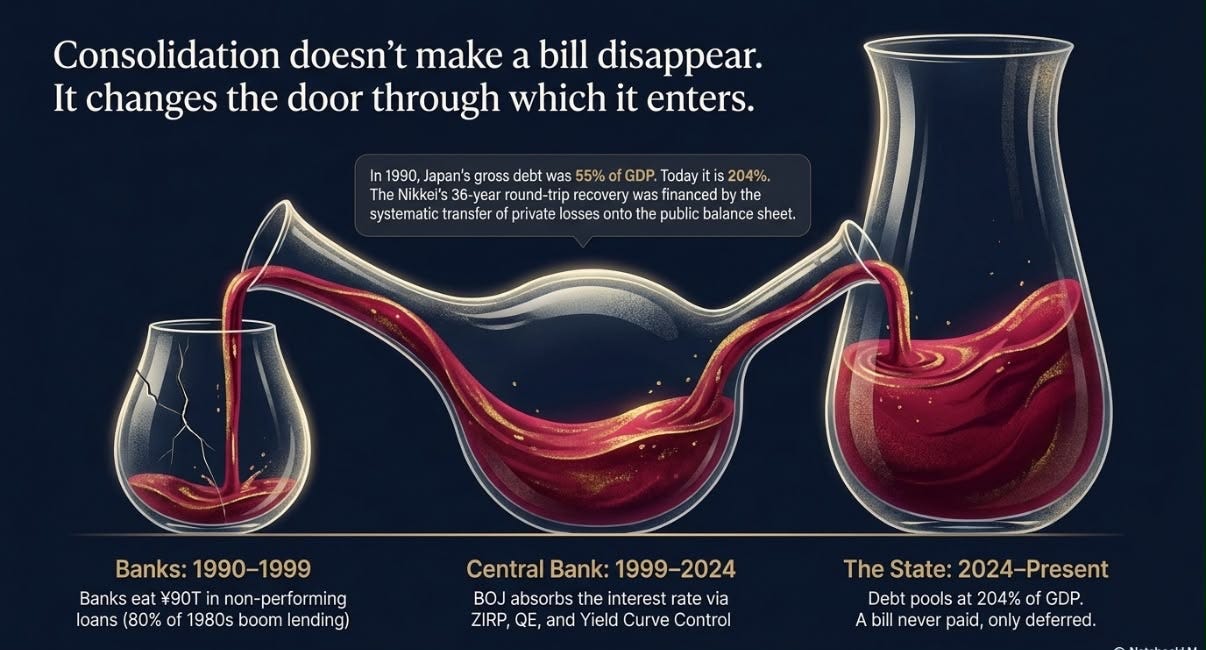
Consolidation doesn’t make the bill disappear. It changes the door through which it enters. When the BOJ raises rates, it must pay interest on the roughly ¥550 trillion of excess reserves created to buy those bonds. Those payments erode, and eventually wipe out, the BOJ’s remittances to the treasury, converting “free” debt into a real fiscal cost through the central bank’s own income statement [14].
Again, for those not familiar with the Japanese financial system, I urge you to simply look at the relationship between the Federal Reserve and the US Treasury. It makes me laugh thinking back to the first time I ever learned about Treasury Remittances, reading the Federal Reserve annual statement in my mid 20s (yes, I am a nerd) and thinking to myself that this was an insane ponzi-esque situation. What is crazy is thinking that the fiscal budget actually relied on those remittances as a revenue line item.
The bill does not arrive as a default. It arrives as a slow inversion of the money machine, and that inversion began the moment the policy rate left zero.
Three stages did the warehousing, and the archival record gives each one a human face.
Stage 1: The Banks Ate the Losses
Rather than write off loans to insolvent borrowers, Japanese banks engaged in what Ricardo Caballero, Takeo Hoshi, and Anil Kashyap documented as systematic evasion.
“Most large Japanese banks were only able to comply with capital standards because regulators were lax in their inspections. To facilitate this forbearance the banks often engaged in sham loan restructurings that kept credit flowing to otherwise insolvent borrowers (that we call zombies).”
Source: Caballero, Hoshi & Kashyap (2008) [15]
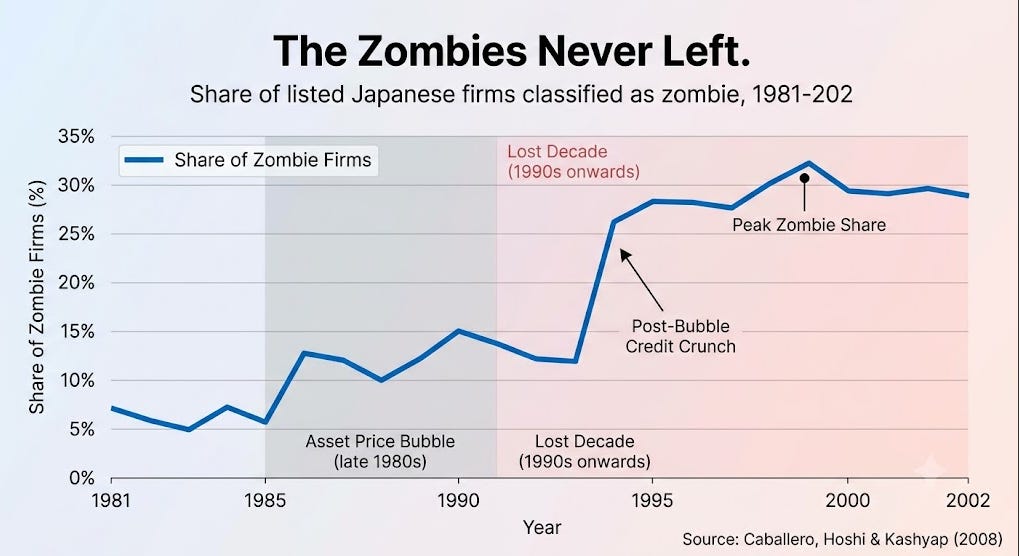
Zombie Companies are a common term for firms that aren’t profitable and rely on the capital markets to maintain operations. Very similar to Minsky’s Ponzi Finance Unit that I discussed in The Railway Hallucination.
The share of publicly traded firms that qualified as Zombie Companies in Japan hovered between 5% and 15% until 1993. Then the zombie share surged above 25% in 1994 and stayed above that level ever since. Not surprisingly, the construction and real estate sectors were the most infested with these walking dead firms [15].
As a side note, it can’t be surprising that the same thing happened in China, with the key event of the real estate collapse being the demise of Evergrande in May 2021. If you are interested in how China swept bad loans and its massive Capital Misallocation™ under the rug, I suggest reading Red Capitalism by Carl E. Walter and Fraser J. T. Howie.
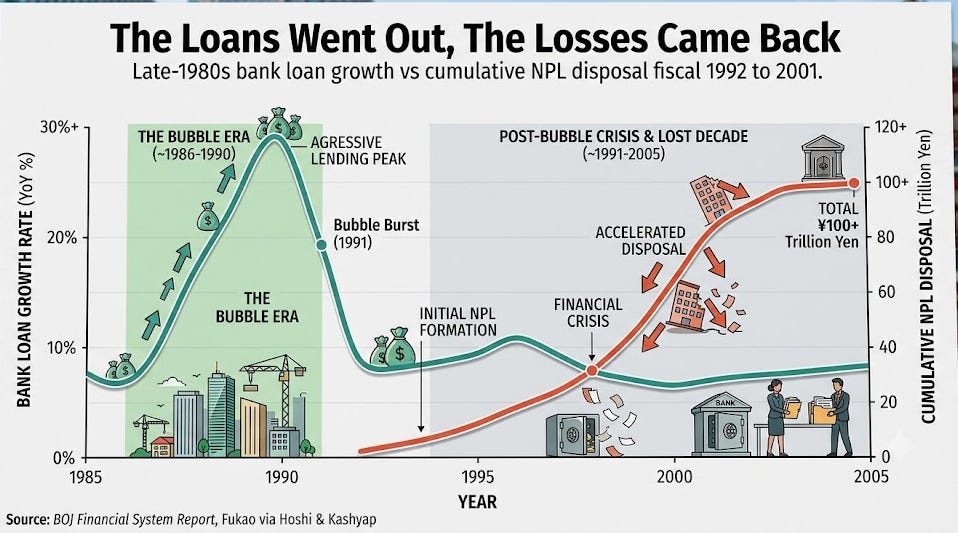
The eventual bill of floating these walking dead firms was enormous. Kunio Fukao’s tally, cited by Hoshi and Kashyap, puts cumulative loan losses at ¥91.5 trillion between April 1992 and March 2002, roughly 18% of 2002 GDP [16]. The number that actually explains this essay is the Bank of Japan’s own framing of the same figure. Its roughly ¥90 trillion of non-performing loan disposal over fiscal 1992 to 2001 was “equivalent to about 80 percent of the increase in loans during the late 1980s” [17].
The loan warehousing took on grotesque physical form. When the BOJ’s rate hikes burst the art market, Japanese buyers who had bought 40% of the world’s fine art at the peak found that all those paintings they acquired became stranded collateral themselves [18].
“Today, as many as 10,000 paintings, valued at ¥1 trillion ($9.5 billion), are stored in bank vaults, secured by the banks as collateral against loans to failed corporations... with some works now valued at no more than 20% of their acquisition price, the paintings remain untouched, out of public view, facing a highly uncertain future.” Source: Japan Inc, December 1999 [18]
Think of them as a 1980s version of 2021 NFTs. Digital images, not even physical paintings, that so many bubble participants were happy to dole out 6 and 7 figures of bubble earnings to purchase during the 2021 crypto mania.
Ryoei Saito spent $160 million of borrowed money in 48 hours on Van Gogh’s Portrait of Dr. Gachet and Renoir’s Au Moulin de la Galette [19], only to commit the ultimate embarrassment by telling the world that the canvases should be cremated with him [20]. He died in 1996 but the paintings survived and vanished into his Japanese empire’s workout pipeline.
Keep those vaults in mind for Act V, where we illustrate how the GPU warehouses run the same playbook today.
Stage 2: The Central Bank Ate the Interest Rate

Loan loss warehousing ultimately led to the 1997 to 1998 banking crisis that ran like dominoes.
Sanyo Securities defaulted on interbank funding loans in November 1997, the first post-WW2 failure of its kind globally. Less than two weeks later, Hokkaido Takushoku Bank, a top 20 largest Japanese bank, collapsed [12]. It was followed by Yamaichi Securities, one of Japan’s Big Four brokerage houses, announcing that it would liquidate roughly ¥260 billion in off-book losses hidden for years, discovered only after the man forced to announce them, president Shohei Nozawa, had held the job for four months [21]. The picture above is a historically important photo of Nozawa breaking down in front of the cameras during the press conference on national television. This event was replayed for days and became one of the landmark images of the Japan crash.
Then the two long-term credit banks went the same way. In October 1998 the government seized the Long-Term Credit Bank of Japan and the roughly ¥26 trillion in assets and ¥50 trillion in outstanding derivatives that it held on its books [12].
The BOJ and the Ministry of Finance deliberately chose the phrase temporary nationalisation over the legally more precise special public administration, specifically to avoid triggering the automatic-termination clauses buried in every one of LTCB’s ISDA derivatives contracts. The ISDA organization issued a public statement confirming it understood and welcomed the distinction, one day before the nationalization took effect, and Japan’s own bankers’ federation echoed the messaging [12].
Things got so crazy that a regulator rewrote its own vocabulary in real time to stop a derivatives book from blowing up the rest of the world.
LTCB was sold in 2000 to a Ripplewood Holdings-led consortium for ¥121 billion and rebranded Shinsei, which means New Life in Japanese. This deal marked the first foreign takeover of a major Japanese bank ever [12].
Two months later, in December 1998, Nippon Credit Bank went down the same route. The Bank of Japan itself held ¥80 billion of NCB preferred shares from an earlier rescue attempt, and the government’s own valuation committee marked them to zero alongside the private banks’ stakes. Nakaso, writing the BOJ’s internal post-mortem, called it a painful moment for the Bank of Japan, which was subsequently criticised for misjudging the financial health of NCB and for misuse of the central bank’s funds. NCB was sold in 2000 to a SoftBank-led consortium and reprivatized as Aozora, which means Blue Sky [12]. Notice the trend in the naming of these new entities.
The machinery built to process all of this went from zero to massive. The Deposit Insurance Corporation grew from 16 staff overseeing ¥390 billion in early 1996 to 2,250 staff managing ¥60 trillion by 1999. The total cost of NPL disposal through fiscal 1999 ran ¥85.9 trillion, roughly 17% of GDP [12].
As much as it pains me to quote this guy, his 1998 diagnosis supplied the intellectual architecture underlying this whole financial tragedy.
“Monetary policy will in fact be effective if the central bank can credibly promise to be irresponsible, to seek a higher future price level.” Source: Paul Krugman (1998) [22]
Former Federal Reserve Chairman Ben “Helicopter” Bernanke gave a similar diagnosis a year later, calling Japan’s paralysis “largely self-induced” and demanding “some Rooseveltian resolve” [23]. The practical effect of the resulting quarter-century experiment was to make the government’s exploding debt costless to service.
Remember, it is always about the cost of debt service, asset price volatility, and supporting the narrative when it comes to running wildly leveraged positions. In markets or in government.
The denial cycle had its own tell, one G7 meeting earlier. In October 1998, standing in Washington, BOJ Governor Masaru Hayami told the room plainly that Japanese banks urgently needed to fix their undercapitalization. It infuriated Japanese bankers, who called the assessment exaggerated. Five months later they took a ¥7.5 trillion government capital injection anyway [12].
The emperor said the quiet part out loud, and the court got angry at him for being right.
Stage 3: The State Ate the Debt
With rates pinned at zero and the BOJ absorbing roughly half the JGB market, the Japanese government’s gross debt at 200%+ of GDP became a curiosity rather than a crisis.
The bill never disappeared. Nobody had to deal with it.
Until now.
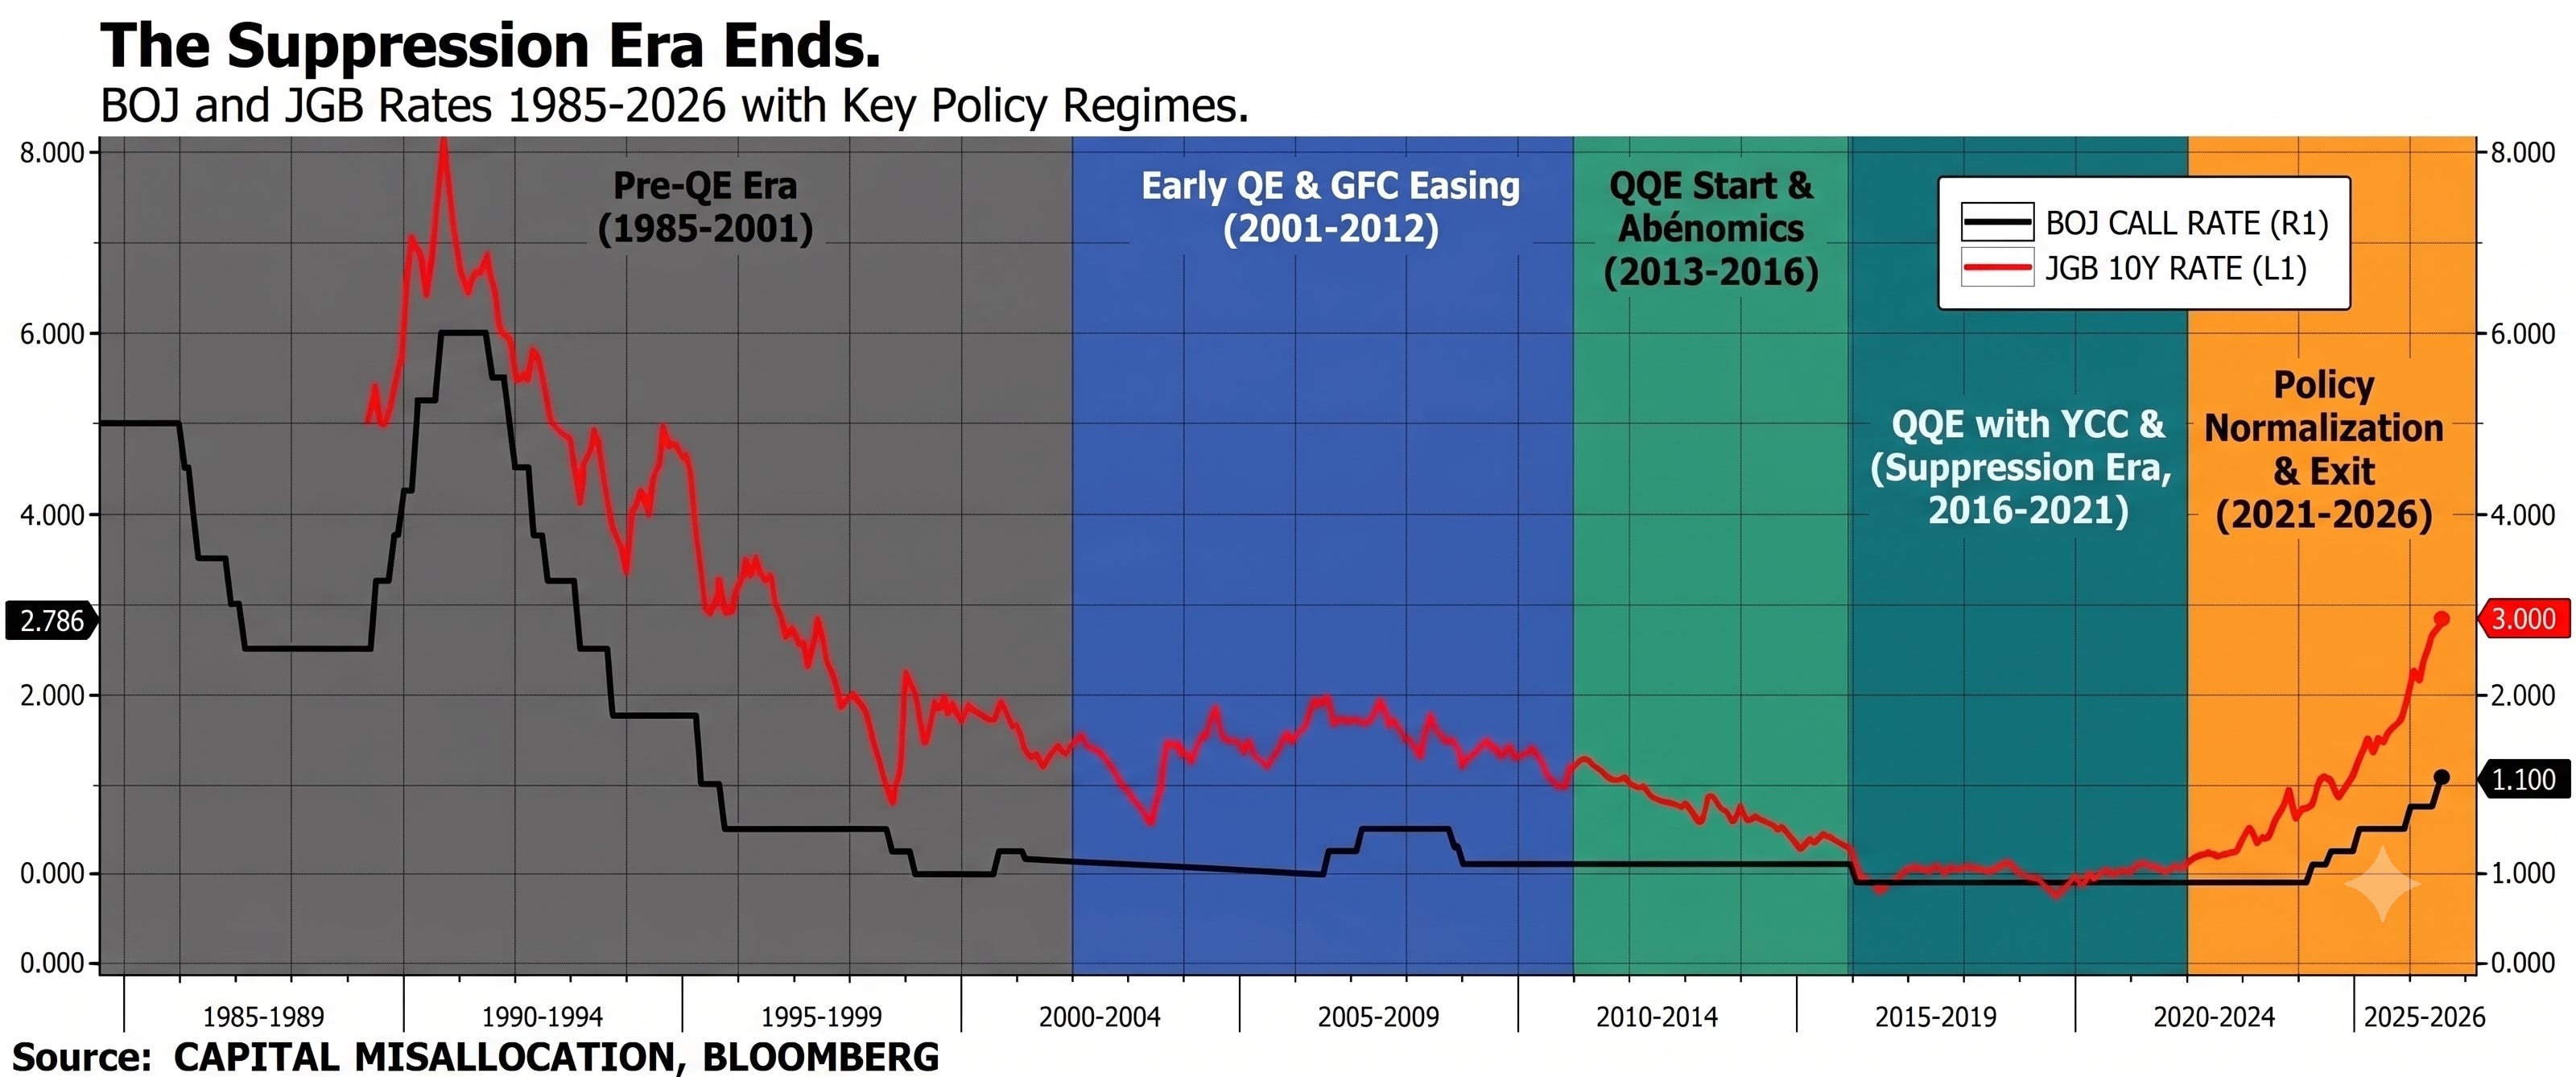
Look at the chart above and read it from left to right. This visual is the anatomy of a deferred payment.
The BOJ spiked the call rate above 8% in 1990 to 1991, and that is the tightening that killed the bubble. Governor Mieno deliberately pricked asset prices after the discount rate had been held at a then-record-low 2.5% for nine quarters. The BOJ’s own post-mortem attributes that hold to a monetary policy “strongly influenced by the framework of international policy coordination” and by a national obsession with “preventing the yen’s appreciation” [24]. That same study by Japan’s central bank offers one of the most honest sentences any central bank has ever published about a bubble within its own territory.
“The bubble was generated by the complex interaction of various factors in a similar way as in a chemical reaction. The process of such a chemical reaction could be termed the process of ‘intensified bullish expectations.’”
Source: Okina, Shirakawa & Shiratsuka (2001) [24]
But then the long admired country of Japan embarked on the long descent that featured rates falling and eventually hitting zero in 1999. The BOJ kept rates at the zero lower bound, with brief aborted escapes in 2000 and 2006 to 2007 right before the GFC, for 25 years.
We can think of this as the first experience where the circuit that is the economy lost capacitance, and thus any attempt at stimulating via the interest channel was met with a no mas por favor response from borrowers. In essence, the Japanese economy became a collapsed field. Yet that didn’t stop the wizards behind the curtain from continuing to try the same approach, which ultimately resulted in the extreme result of taking the 10-year JGB to negative 0.28% in 2016. Investors paying the most indebted major government on earth for the privilege of lending to it. A truly perverse situation.
Now look at the far right section of the chart. What you see is the fastest sustained rise in Japanese policy and long rates since the 1980s. The BOJ exited negative rates and yield curve control in March 2024, hiked to 0.25% in July 2024, and reached 1.0% in June 2026, its highest policy rate since 1995 [25].
I am finalizing this essay on July 31st, 2026, and the BOJ came out with a relatively hawkish pause after Warsh decided to punt on a hike and the Japanese MOF intervened in the FX market just a day ago. This is all while the 10-year yield sits close to 3.00%, a level unseen in three decades [26].
Every percentage point of yield is a percentage point of the old bill becoming visible again. Japan must refinance a debt stock exceeding ¥1,300 trillion, and planned FY2026 issuance of ¥30 trillion already exceeds the prior plan [26]. Through the consolidated balance sheet, every BOJ hike also raises the interest bill on half a quadrillion yen of reserves.
The suppression era did not eliminate the cost of 1989. It stored that cost in duration. Duration is now repricing in real time.
The Princes Did It On Purpose
I simply can’t write a piece on the 1980s Japanese bubble without referencing one of the seminal researchers on the period, Dr. Richard Werner. Richard spent the crash years as a visiting researcher inside the BOJ, then spent the following two decades building the paper trail the official histories skip. He authored a wonderful book called Princes of the Yen, and I included the link to the video summary of it that is available on YouTube for you to watch if you haven’t ever read the book.
Dr. Werner’s finding was that the boom and the bust were run through a mechanism most economists still don’t teach: window guidance. Window guidance is basically informal and extralegal quotas dictating exactly how much each bank could lend and to which sectors, independent of the discount rate the textbooks fixate on.
It wasn’t the price of money that inflated the bubble. It was the quantity of credit lent by the Japanese banks. Werner argues that the quantity of credit was a number the BOJ wrote down and handed to bank presidents in private meetings that left no legislative record [27]. In the back half of the 1980s those quotas ran close to 15% annual loan growth, aimed straight at real estate and stocks. To quote one city bank president’s own words, “We wanted a certain amount of loan increases but the Bank of Japan wanted us to use more” [27].
Let’s be honest. That is not a market discovering irrational exuberance on its own. That’s a regulator ordering an asset bubble into existence.
Werner’s harder claim is that none of this was a mistake the BOJ made and later regretted. It was the plan. A continuous lineage of BOJ leadership (Sasaki, Maekawa, Mieno, Fukui) used the bubble, and the crash that followed it, as the lever to do what decades of normal politics couldn’t accomplish. Namely, to break the MOF’s grip on the economy and force Japan into the liberalized system the princes had wanted since their own postwar training. Once the crisis was manufactured, its cure was withheld on purpose. The BOJ had the tool to end the Lost Decade in a quarter, meaning expanding credit for productive lending, and instead spent it strangling growth for years past the point recovery was politically survivable, because a recovery too early doesn’t produce structural reform [27].
A crisis you can fix immediately isn’t a crisis. It’s a delay tactic. The Lost Decade wasn’t lost. Werner argues it was scheduled.
This context matters for the compute standard for one reason. Credit direction, not credit price, is always the mechanism to watch, and it is never accidental for long.
Nobody is issuing formal window guidance to hyperscalers today. The equivalent exists anyway, distributed across a smaller, more concentrated set of actors. The banks are racing to underwrite GPU-collateralized facilities at SOFR plus 250 to 350bps. The vendor-financing loops run between the chip makers, the cloud providers, and their own biggest customers. The rating agencies are stamping investment-grade on financing structures backed by four to five year useful life hardware.
Dr. Werner’s own Quantity Theory of Credit argues that credit funding real GDP transactions is productive, while credit funding the purchase of existing or speculative assets produces exactly one thing: asset inflation [27]. As we discussed in The Railway Hallucination, even if the technology is real, it doesn’t mean the capital is safe, as the cash flows needed to support asset prices might simply be too far into the future to justify the extended valuations that exist today grounded in hype and lofty expectations.
Judged by that standard, the data-center shells and the power contracts clear the bar. They are bankable collateral. The GPU stack financed through circular vendor loans and off-balance-sheet SPVs does not meet the hurdle.
MUFG’s own institutional memory runs through every chapter of this story. It survived the princes’ engineered collapse of the system it was built inside. It now underwrites the system replacing it, whether by design or by habit. The bank that watched credit get directed into land in 1980s Japan is now watching credit get directed into compute in 2026.
Werner would tell you that isn’t a coincidence.
There is a second mechanism running underneath the first, and it does not compete with Werner’s account. It completes it. The BOJ has published its own internal post-mortem describing a genuine institutional trap. In early 1993, the BOJ had already identified the concentration of real estate lending as potentially dangerous, but sounding that alarm publicly risked triggering the very panic a comprehensive safety net was supposed to prevent. And building that safety net required a level of public disclosure the political system wasn’t yet ready to grant [12].
Two engines, one outcome. The princes had a structural incentive to let the bubble run its course and use the wreckage to break the MOF’s grip. The institution built around them had no clean exit ramp once it needed to move without triggering the collapse it was managing.
What’s crazy is that both are true and neither excuses the other.
The Yield Curve Wakes Up
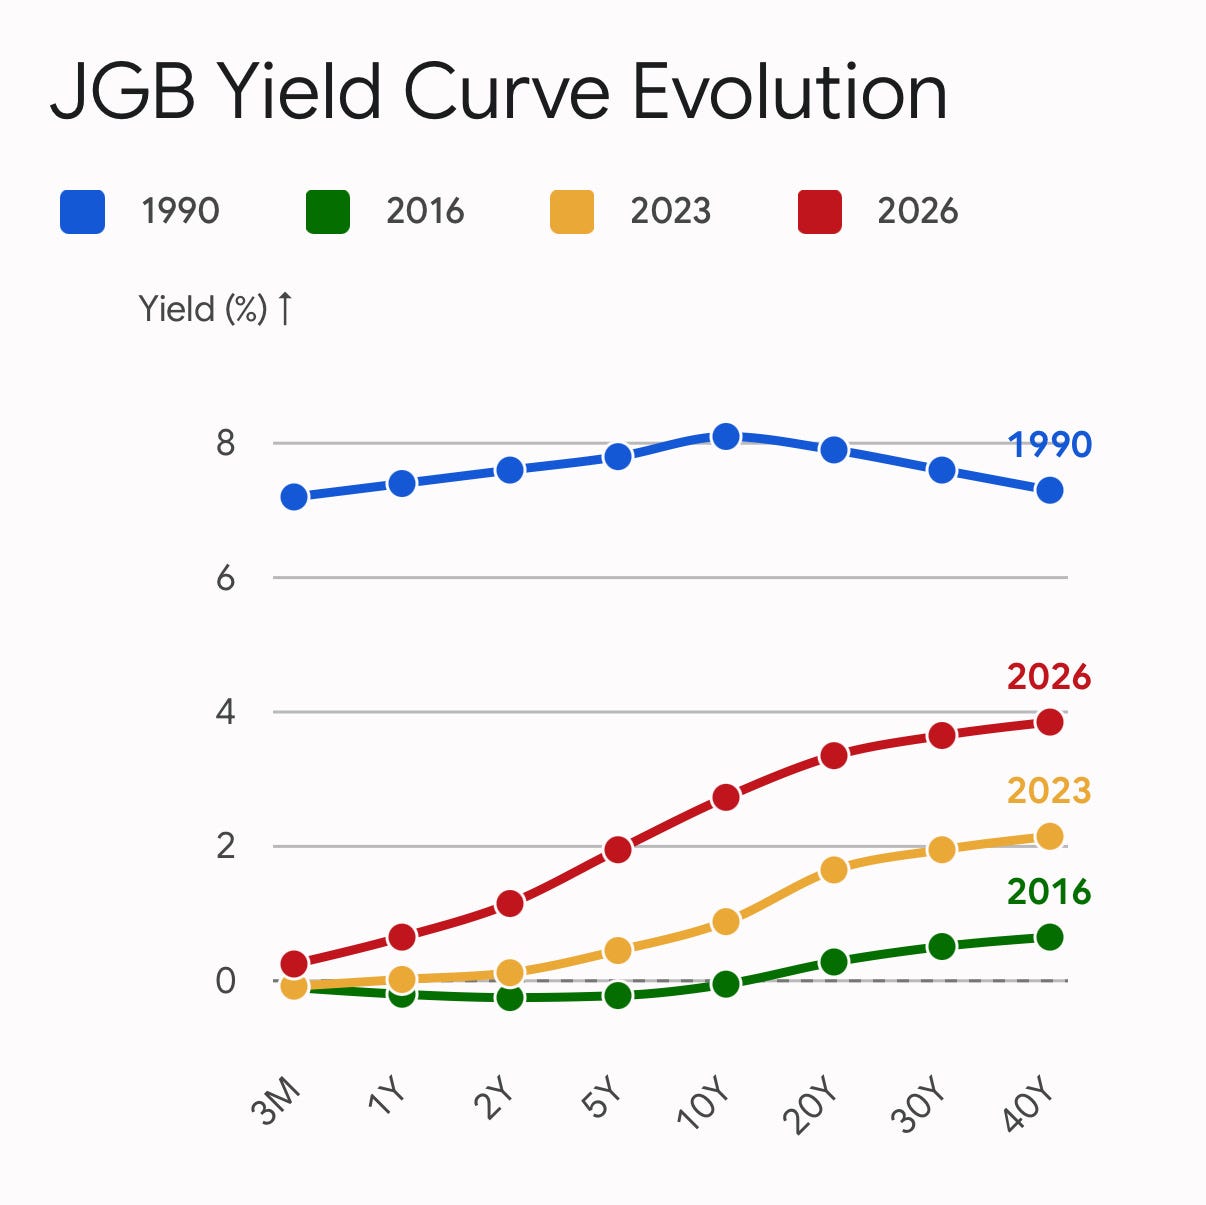
The 1990 curve is the old world that I discussed on the Benny & The Squirrel podcast last night, a world that extends beyond Japan to all yield curves, before a positive term spread was necessary to make the system work by inviting carry traders to provide the capital needed to support both financial and real economy cost structures. Specifically in 1980s Japan, the entire curve sat at roughly 8% as the BOJ strangled the bubble.
The 2016 curve is the deep freeze: negative out to 15 years, the 40-year at a third of a percent. The 2023 curve is the eve of exit. The 2025/2026 curve is the awakening, with short rates above 1%, the 10-year almost at 3%, and the ultra-long end near 3.9%, after the 40-year touched roughly 4.4% in May [26].
Two features of the 2026 curve matter.
First, the steepness. The 1y40y forward rate is among the widest in the developed world. You can read this as a bond market pricing not just higher policy rates but a structural fiscal premium, compensation for holding the paper of a government that has clearly not shown any respect for its currency or its citizens’ purchasing power.
Second, it is important to acknowledge who is buying. Traditional domestic holders (the BOJ, life insurers, banks) have stepped back, and foreign investors have flooded into the 20 to 30 year sector at record pace. The marginal price-setter of Japanese government debt is increasingly a foreign capital provider who can leave when they feel their capital isn’t being treated well.
Registry evidence adds an important wrinkle to this equation. Loan-to-value ratios on Japanese property lending were actually counter-cyclical during the late 1980s, hitting their lowest levels at the height of the bubble. The credit expansion came from the rising value of the collateral base, and from regulators letting banks count unrealized equity gains toward capital, not from lenders advancing a higher percentage against each parcel.
The system didn’t get reckless loan by loan. It got enormous in aggregate, against an asset class that could only be worth what the next lender would lend against it.
Keep that mechanism in mind for Act IV. The compute standard runs the identical trick on a four-year depreciation schedule instead of a multi-decade asset life.
This is the context in which Prime Minister Takaichi’s ¥370 trillion economic blueprint was approved on July 21, after being rewritten repeatedly because the bond market kept revolting at drafts that read as instructions to the central bank. An early version calling for monetary policy “that bolsters private demand” was deleted after yields spiked. A later version tying BOJ policy to growth objectives jolted markets and gained a hastily inserted footnote acknowledging the Bank’s legal independence [28].
Former BOJ board member Seiji Adachi’s verdict was unsparing:
“The administration wants the BOJ to keep rates low so that it can issue more debt. That’s not a good message to send to markets.” Source: Seiji Adachi, July 21, 2026 [28]
Students of the 1980s will recognize this instantly. The institutional flaw that all of the post-mortems identified as the bubble’s true cause was a central bank subordinated to external objectives. It was exchange-rate management under the Plaza Framework back then. Now it is the financing needs of the treasury.
The IMF added its own dry warning:
“High and persistent debt levels, together with a deteriorating fiscal balance, leave Japan’s economy exposed to a range of shocks.” Source: IMF, Japan 2026 Article IV Consultation [14]
The Strongest Counterargument
A dissenting reading of the chart above is that it depicts a success. What my friend David Dredge, CIO of Convex Strategies in Singapore, likes to refer to as “what if it works?”
Japan finally has inflation, nominal growth, 5%+ shunto wage settlements, and a central bank that is normalizing in an orderly, telegraphed fashion. Households hold ¥2,200+ trillion in financial assets and the NISA reform is rotating savings into equities. The counterargument would say that this is a normalization story mislabeled as a crisis.
Japan does have shock absorbers that its policymakers in 1989 could only have wished to possess. However, those shock absorbers change the form of the reckoning, not its existence. With the BOJ as buyer of last resort and a state that cannot afford high real rates, the realistic tail is not a JGB default. It is currency-absorbed fiscal dominance, with the bill paid through the yen.
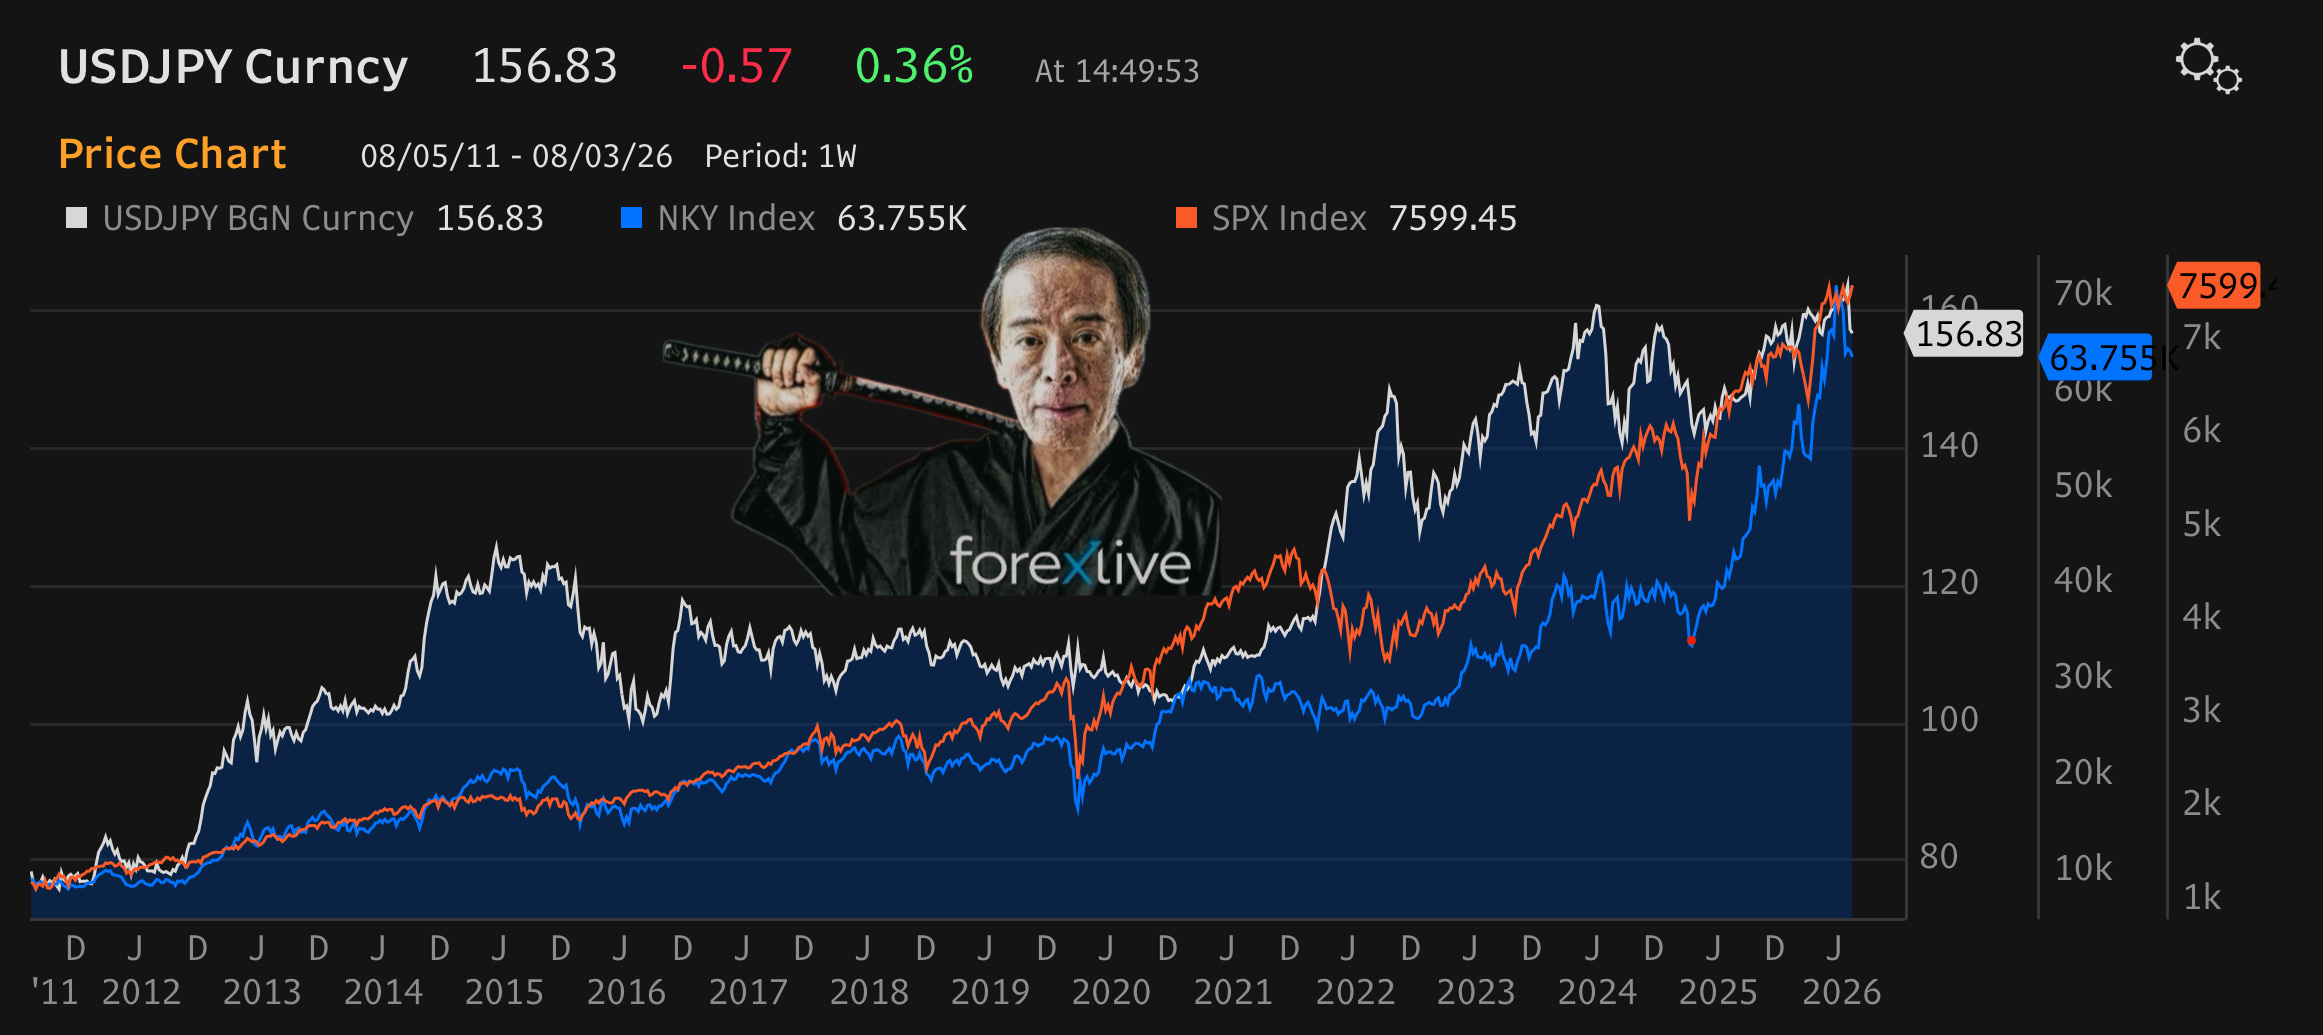
As most followers of mine know, I have been a massive Yen bear since 2011 and remain one, even though I am conscious of and respect the left tail skew present in any asset that serves as the funding leg in a carry trade. Look no further than the 5 to 6 big figure move lower in dollar yen that we have seen since Wednesday. But trying to delay the rate of change of Yen depreciation isn’t the same as actually pursuing the policies needed to promote Yen strength. Remember, the BOJ may finally be raising rates, but the overnight call rate still sits at a negative 100bps real rate.
The bill paid through the yen is, as Act III shows, a bill forwarded to every borrower of yen on earth.
ACT II: TWO METERS, ONE CLOCK
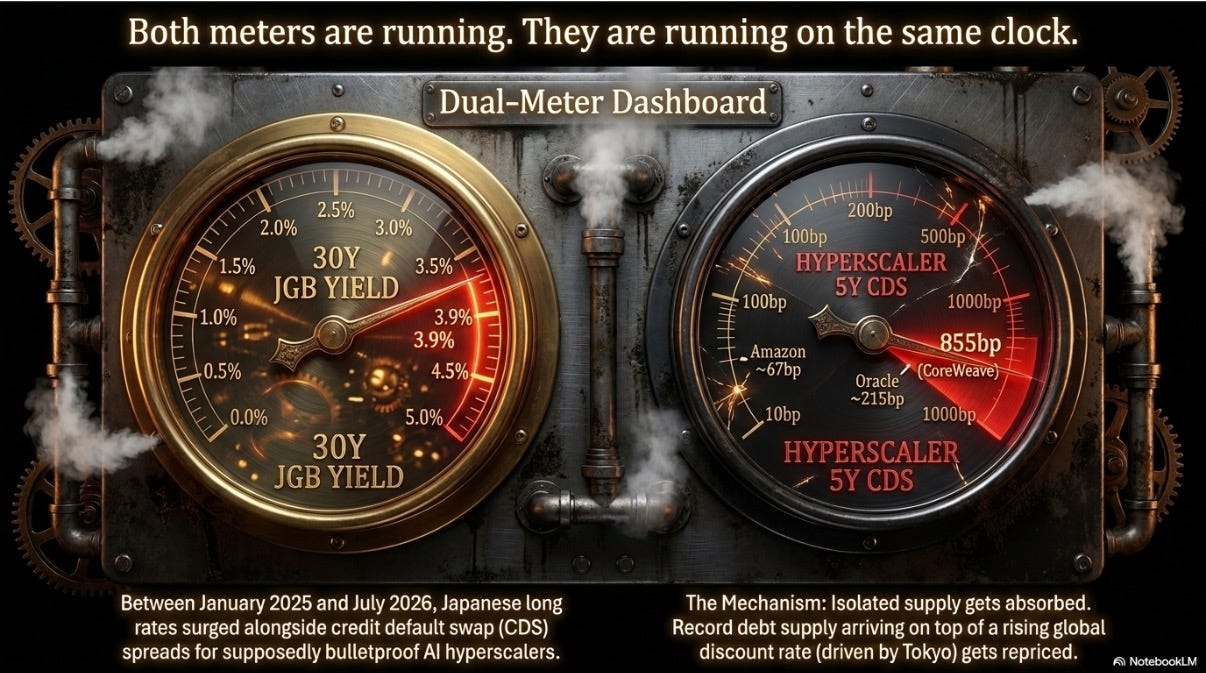
If this thesis is right, and the repricing of Japan’s deferred bill is genuinely transmitting into the credit of the AI build-out, it should show up in market prices on two meters at once. The long end of the JGB curve should be rising as Japan’s fiscal premium reprices. And credit default swap spreads on the hyperscalers should be widening as their debt stock balloons into a rising global rate environment.
Both meters are running and they are operating on the same clock.
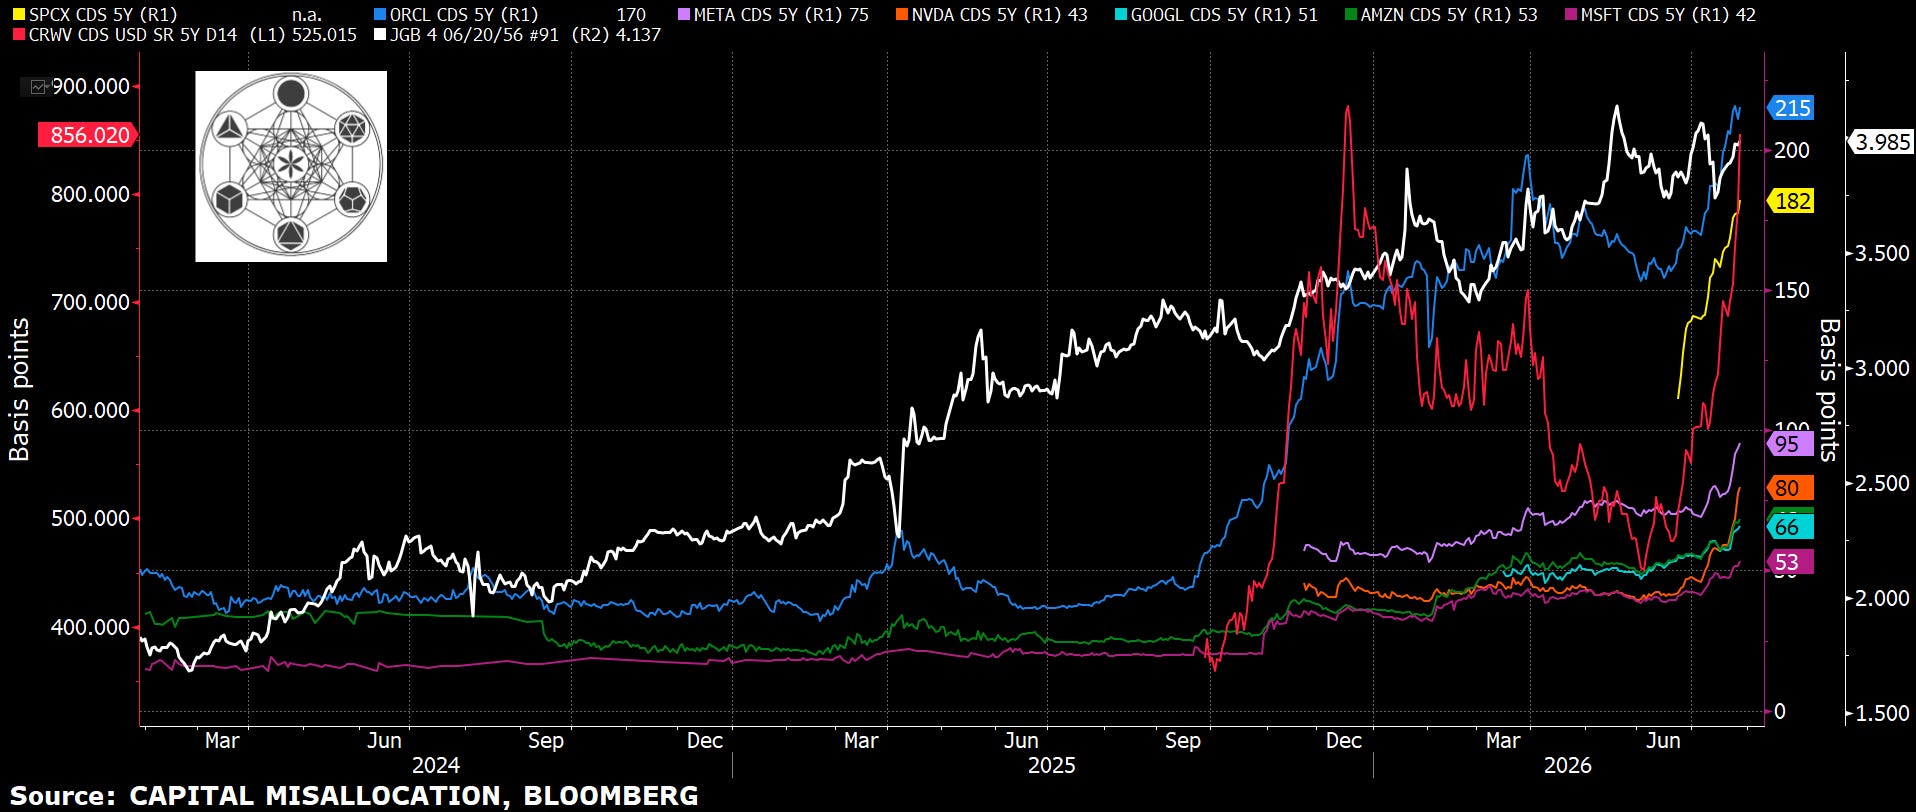
Between January 2025 and July 2026, the 30-year JGB yield climbed from roughly 2.3% to about 3.9%, brushing record levels [26]. Over the same window, five-year CDS on the supposedly bulletproof hyperscaler complex went from dormant to bid, and the week of July 29 alone rewrote nearly every one of these levels into record territory at once.
Amazon at roughly 66bps. Alphabet near 67bps. Microsoft in the same band. All still investment-grade tight in absolute terms but multiples of their start-of-2025 levels. Meta at 94bps. SpaceX, in its first year as a rated credit, at roughly 185bps. Oracle, downgraded to BBB- by S&P on July 9, 2026, explicitly because AI capex was straining its cash flow, now at roughly 215bps and climbing, having traded in late 2025, in Bloomberg’s phrase, “like junk,” and actually trading at spreads above 300bps in the private market [29] [30].
Further down the credit spectrum, CoreWeave’s spread has blown out to roughly 855 basis points as of the week of July 29 [30]. At a standard 40% recovery assumption, that implies something close to a 50% five-year cumulative default probability for the most important pure-play compute lessor in the AI economy.
Read the shape, not just the level.
Some of these prints look, at first glance, like relief. Meta and Amazon sit below where an earlier snapshot of this same complex had them. They are not relief. The monitor’s own analysts flag nearly the entire board hitting fresh records in the same trading week, which means the apparent decline in a couple of names is a function of which exact day and tenor got marked, not a reversal of direction. When every name in a complex reprints new highs in the same five trading days, arguing over which name moved the most misses the point.
The point is that they all moved.
Correlation across two rising series proves nothing by itself. The claim runs through three specific channels.
Term Premium. Japanese institutions are the largest foreign holders of US Treasuries and a structural bid for global duration. As JGB yields rise, that bid weakens and global long rates carry a higher floor, raising the discount rate on every long-dated cash flow. There are no longer-dated cash flows in today’s market than “AI infrastructure pays off in the 2030s.”
Funding Cost. The Yen is the world’s cheapest major funding currency, and every BOJ hike raises the cost of the leveraged positions financing risk assets globally.
Refinancing. The AI complex has just created, in eighteen months, several hundred billion dollars of new bonds and leases that must be rolled in whatever rate environment prevails at maturity. The marginal environment is being set, at the long end, partly in Tokyo.
A Fair Objection
Amazon’s own $89 billion of 2026 issuance (see Act IV) is, by itself, enough supply to move its own CDS. You don’t need Tokyo to explain a company drowning its own capital market in new bonds.
That’s true, and it’s also not a competing explanation, it’s the same one. Company-specific supply and a rising global cost of funding are not alternatives. They compound. The reason Amazon can print $89 billion and have the market price it as incrementally more dangerous rather than shrug it off as routine is that the marginal buyer’s cost of capital is simultaneously rising for reasons that have nothing to do with Amazon.
Isolated supply gets absorbed. Supply arriving on top of a rising discount rate gets repriced.
Mid-July 2026 supplies the sharpest single data point. In the same week ultra-long JGB yields pushed toward records ahead of the Takaichi blueprint, Amazon’s CDS widened 45 basis points, the largest weekly move in the complex all year [28] [30].
Markets do not reprice default insurance on an AA-rated, cash-generative monopoly by roughly 400% in eighteen months for no reason. They do it when the quantity of debt and the cost of the marginal dollar are both moving against the borrower at once.
Both halves of this are official doctrine. The BIS has measured how a BOJ hike detonates global risk assets through the carry trade. The BIS and the IMF have both flagged AI capex debt as a systemic concern. Nobody has published the sentence that connects them.
I’m publishing it now and here.
There’s a rhyme in the instruments themselves. In January 1990, two weeks after the Nikkei peaked, Salomon Brothers brought 10.3 million Nikkei put warrants to the American Stock Exchange at $4.05 apiece [31]. One of the first liquid vehicles for betting against the Japanese miracle, launched at the precise moment the consensus considered such a bet absurd. The warrants doubled within months.
Hyperscaler CDS in 2026 sits in the same structural position. An instrument that barely traded eighteen months ago, suddenly liquid, suddenly bid, because someone wants insurance against the unthinkable.
A Quantitative Postscript
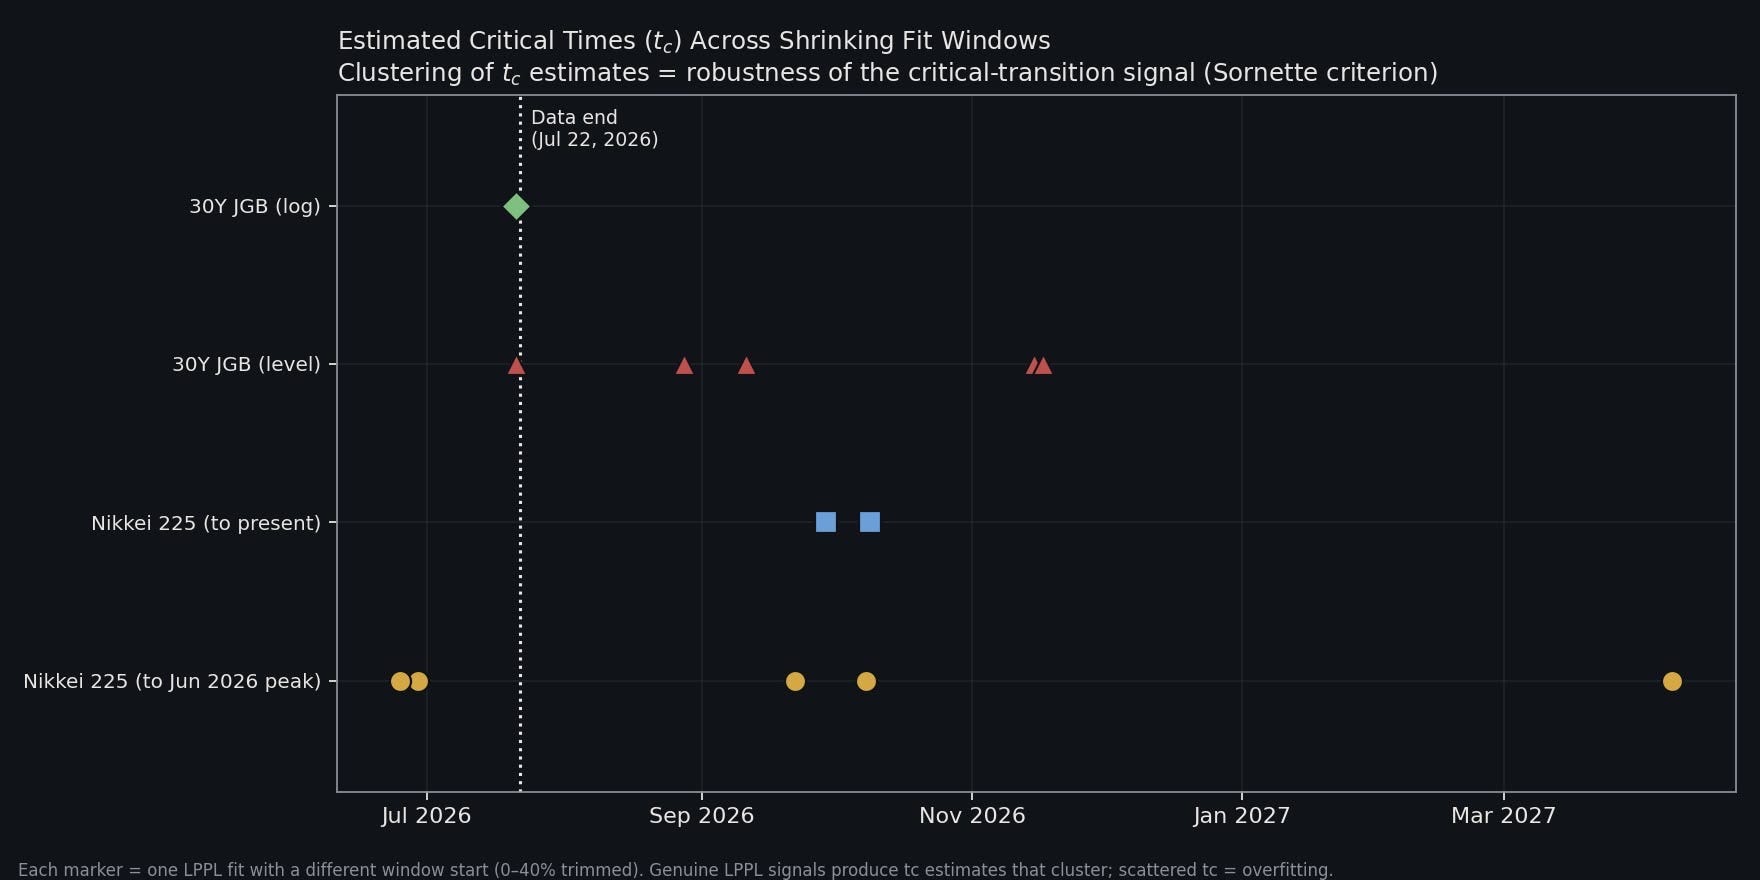
For readers who want the math. Both series can be tested with the Johansen-Sornette log-periodic power law framework academics use to characterize genuine bubbles [32] [33]. The Nikkei’s 2024 to 2026 advance passes the strict-filter diagnostics for a qualified LPPL bubble. The JGB fit hasn’t yet resolved, which is the model’s way of saying the acceleration hasn’t broken. Without diving too deep into LPPL math, I included the results of the analysis on the Nikkei and JGB 30-year in Appendix A. Read both as evidence of shape and potential, not an exact schedule.
If BOJ suppression genuinely acted as a damping term on the global financial system, and its removal permits super-exponential dynamics, then the 2024 to 2026 Nikkei run-up and the JGB yield spike should exhibit the signature of systems approaching a critical transition. Faster-than-exponential growth decorated with accelerating log-periodic oscillations, the pattern formalized in the Johansen-Ledoit-Sornette model and used by Sornette’s group to diagnose, ex ante, episodes including the 1990 Nikkei peak itself and its subsequent anti-bubble [32]. Again I have included the charts are included in Appendix A at the end of the essay.
As a few very well known and well respected volatility hedge fund managers reminded me, treat Sornette as evidence of signal, not an exact date.
ACT III: THE WORLD’S CHEAPEST FUNDING LEG

Why should a JGB repricing and a Tokyo fiscal drama matter to anyone outside Japan? Because the suppression era did not merely warehouse Japan’s losses. It turned the yen into the funding leg of the global financial system. Unwinding that arrangement is the most direct mechanism by which the old bubble’s bill gets forwarded to everyone else.
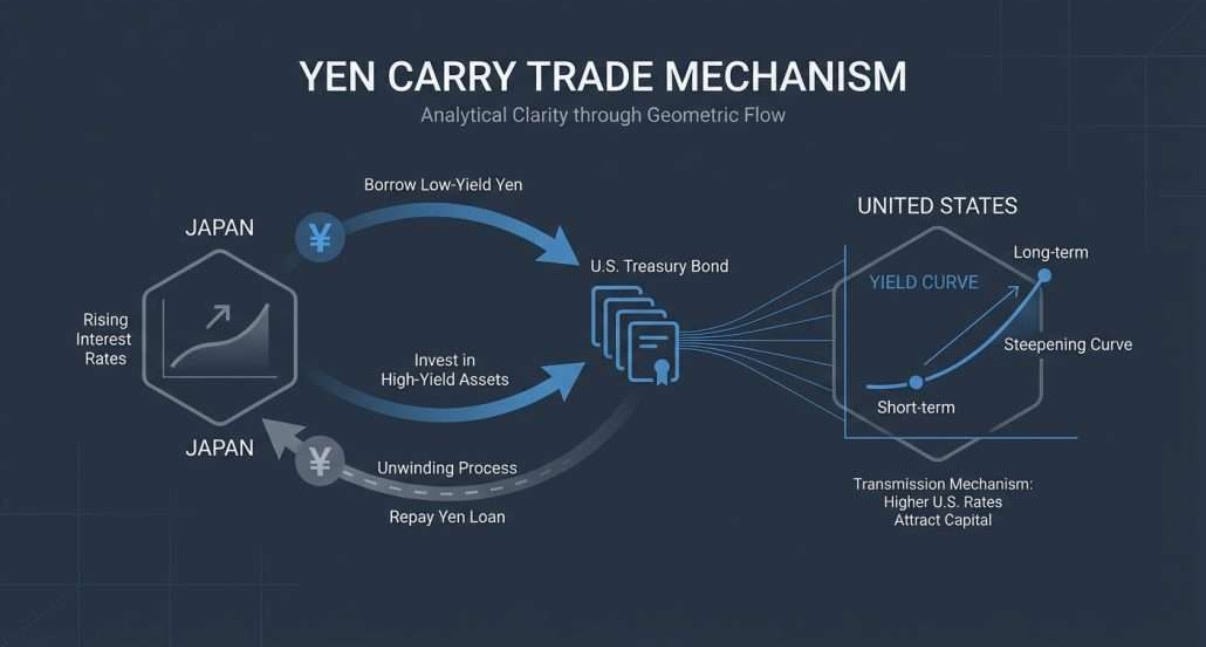
The mechanics are simple and, in calm times, wonderfully profitable. Borrow yen at Japan’s suppressed rates, convert into dollars or other currencies, buy anything that yields more. Treasuries, Nasdaq, private credit, Mexican pesos.
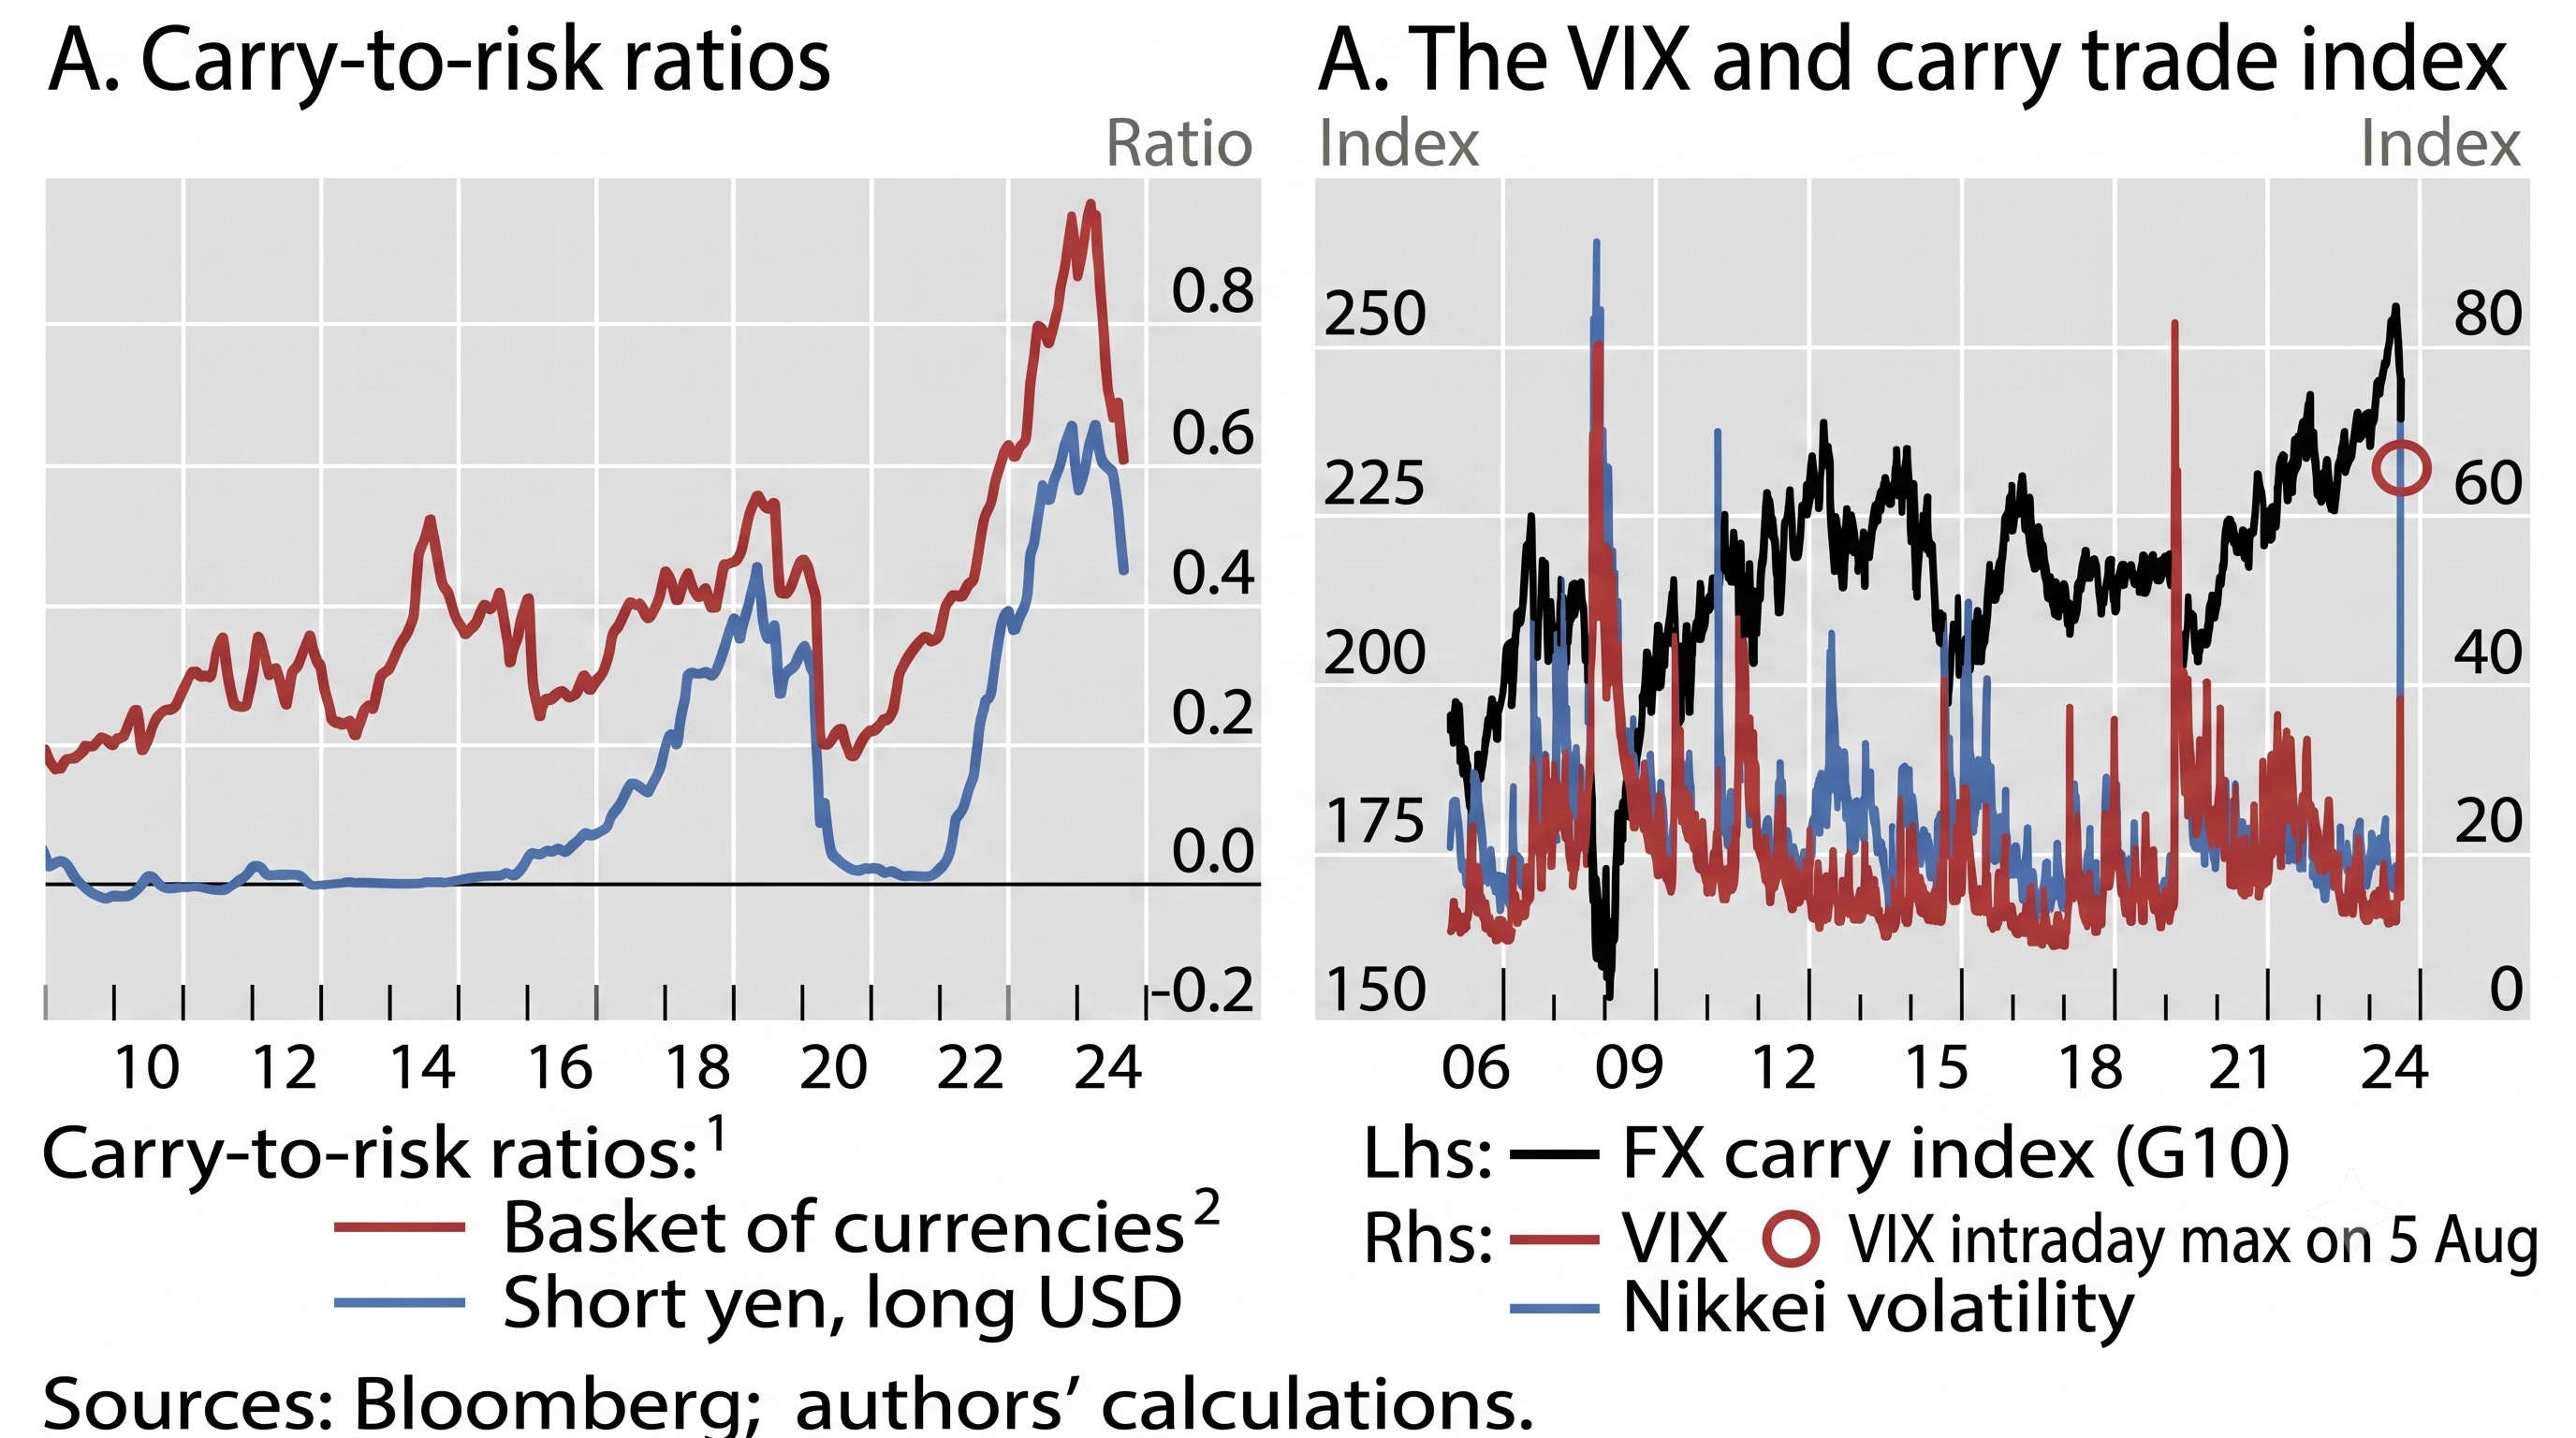
The BIS, in its post-mortem of the August 2024 unwind, estimated the FX carry trade at “a rough middle ballpark of ¥40 trillion ($250 billion) going into the event, which, if anything, is biased down due to data gaps,” sitting atop nearly ¥14 trillion in interbank yen flows and more than ¥80 trillion of cross-border yen claims on offshore centres like the Cayman Islands [34]. The BIS’s description of the strategy’s risk profile deserves quotation for its plainness:
“As carry strategies tend to generate small but consistent returns at times of market calm, but quickly generate steep losses as turbulence erupts, they are often portrayed as ‘picking up nickels in front of a steamroller’.” Source: BIS Bulletin No. 90 [34]
The Yen Carry Trade Steamroller
August 5, 2024 was the dress rehearsal for what the steamroller does.
The BOJ raised its policy rate by all of 15bps to 0.25%. Within days, the Nikkei suffered its worst session since October 1987, down 12%. The VIX spiked above 65. Margin calls cascaded through clearing houses, with the Japan Securities Clearing Corporation raising initial margins on equity index longs by 60 to 80%. Bitcoin fell 20% as retail traders liquidated whatever was liquid [34]. The IMF’s April 2026 Global Financial Stability Report later confirmed the episode measurably tightened US financial conditions [35]. Japan’s monetary policy, transmitted through leveraged funding positions, moving the price of risk in New York.
The Squirrel 🐿️ and I have been hammering on this carry trade channel on the podcast for months. The essential point for 2026 is that the trade wasn’t retired after the rehearsal. It was rebuilt larger.
CFTC data show speculative net short yen positioning reaching approximately 122,700 contracts in mid-2026, exceeding the extreme that preceded the August 2024 unwind [36]. Futures positioning is a proxy for the visible, speculative tranche of the trade, not its full size, which even the BIS concedes it cannot fully observe. But the direction of the evidence isn’t ambiguous. The yen at roughly 163 per dollar is weaker than on the eve of the 2024 crash, the rate differential remains wide enough to feed the position, and the pool of yield-hungry assets on the other side of the funding leg has only grown. Swollen, above all, by the debt of the AI build-out itself.
The Casualty Nobody Talks About
If you want to know what normalization does to a Japanese lender, you don’t need a model. You need a name. And as it happens, this one is a preview of what happens to the AI complex’s own lenders when the funding leg they’re standing on moves.
Norinchukin Bank is the central financial institution of Japan’s agricultural cooperatives, one of the country’s largest institutional investors, and a lender that was up to its neck in the jusen housing loan disaster of the 1990s. It spent the suppression era doing exactly what the suppression era rewarded: reaching abroad for yield, accumulating an enormous portfolio of low-coupon US and European government bonds funded in cheap yen.
Then rates normalized.
In June 2024 Norinchukin announced it would liquidate more than ¥10 trillion of foreign sovereign bonds. For the fiscal year ended March 2025 it booked a consolidated net loss of ¥1.8 trillion, roughly $11.7 billion, the largest in its century-plus history. It still carried well over ¥1 trillion in unrealized bond losses at mid-2025. CEO Kazuto Oku resigned [37].
A jusen-era lender, killed a second time, by the same bill arriving through a different door.
Nobody called it a crisis. There was no bank run, no bailout, no televised weeping. The loss was simply absorbed, the CEO replaced, the portfolio restructured.
Which is precisely the point of this essay. The bill has been arriving in installments for thirty-six years and it almost never looks like a crisis when it does.
Norinchukin is the domestic case. The carry trade is the global one, roughly two orders of magnitude larger. Every hike that dismantles the suppression machinery claws back a funding subsidy the world has been drawing on for twenty-five years, from positions that dwarf anything that existed in 1990.
The margin call on that assumption arrives in yen.
ACT IV: THE COMPUTE STANDARD
The strongest bull case against this thesis used to be simple. The AI capital expenditure boom is free-cash-flow funded, not leveraged, making it a fundamentally different animal from 1980s Japan.
That characterization was true in 2023 and most of 2024.
It is dead wrong in July 2026, and the magnitude of its wrongness is itself the story.
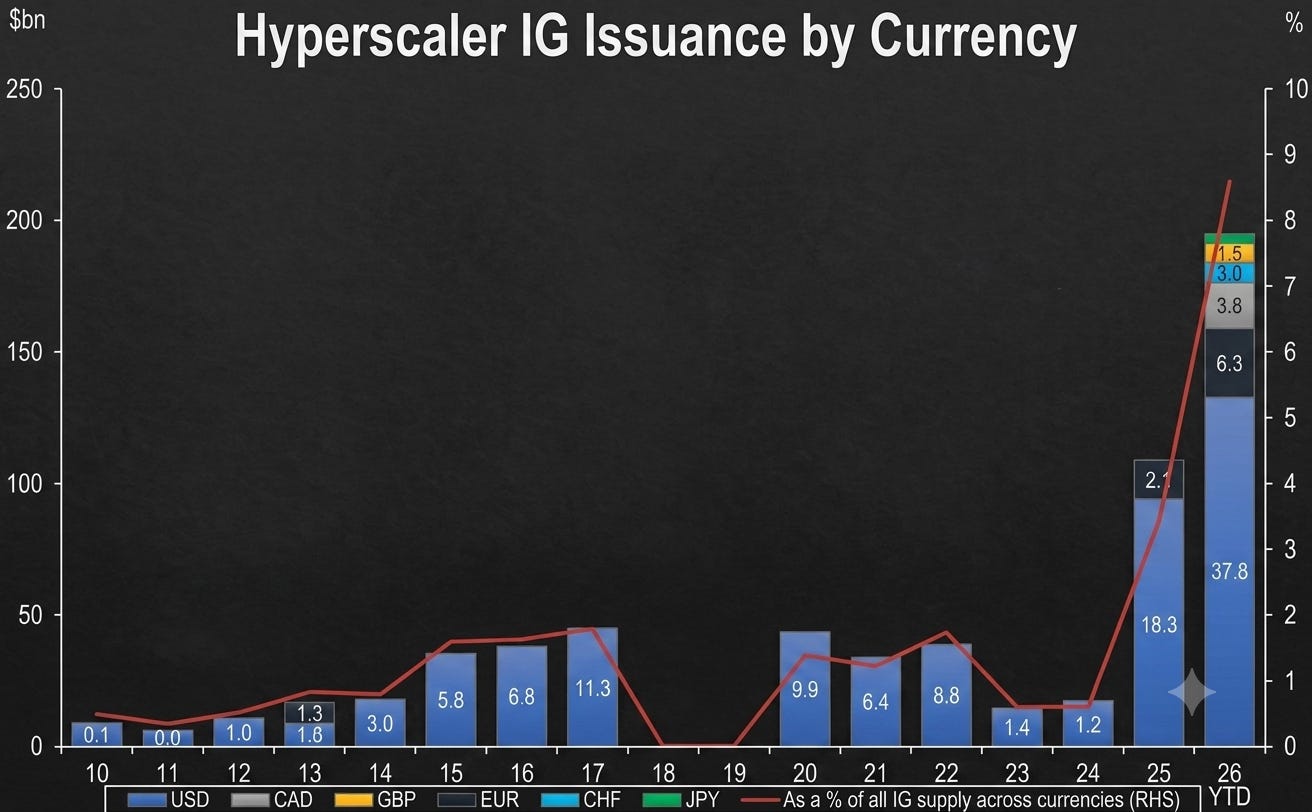
The funding regime flipped in late 2025 and the numbers are no longer close. Investment-grade technology bond issuance reached approximately $182 billion in the first seven months of 2026, a 1,300% increase year over year off a small 2025 base, with Q4 2025 alone contributing $108.7 billion [38] [39]. JPMorgan projects record total IG supply of $1.81 trillion for the year, largely on the back of AI-related borrowing [40].
Narrow the lens to the hyperscalers alone and the shape is even starker. Their bond issuance ran roughly $20 billion in 2024. It reached about $109 billion in 2025, with roughly $90 billion of that crammed into the final four months. And it hit approximately $152 billion in the first four and a half months of 2026 alone, on pace for something near $300 billion for the full year [41].
In eighteen months, a sector that did not borrow became one of the largest growth engines of the American investment grade market.
Company by company, the tape reads like a syndication league table, not a cash-flow statement:
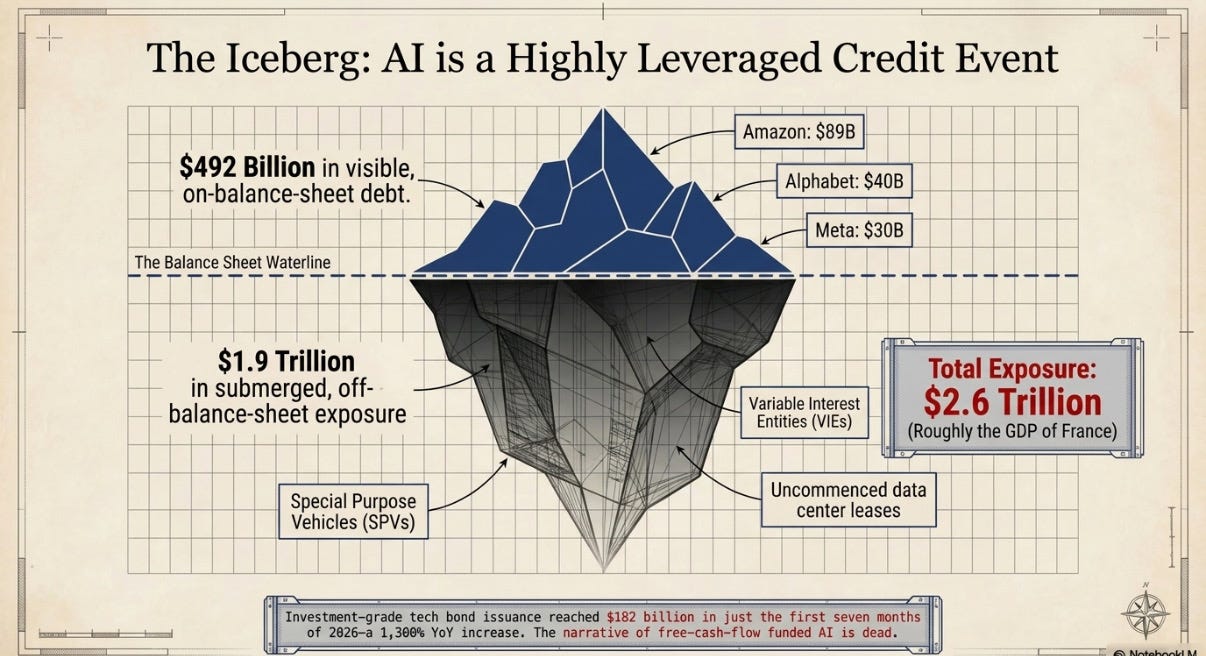
Amazon: roughly $89 billion of debt issued in 2026 alone, including a $25 billion eight-part offering on July 7.
Alphabet: roughly $40 billion of bonds including a 100-year sterling tranche, plus the largest follow-on equity raise ever at $84.75 billion, anchored by Berkshire Hathaway. On-balance-sheet debt up 67% in a single quarter. Purchase obligations up from $149 billion to $233 billion.
Meta: a record $30 billion of bonds, plus its Hyperion data-center campus financed through a roughly $30 billion special purpose vehicle led by Blue Owl. Debt that lives off Meta’s balance sheet in exactly the way that would have made a 1980s Japanese CFO nod in recognition.
Oracle: $25 billion more in debt, downgraded to BBB-, one notch above junk, by S&P on July 9, explicitly because AI capex was consuming its cash flow.
CoreWeave: 9.75% on its bonds, drawing on the $8.5 billion facility MUFG co-structured.
SpaceX: a June bond with a 2056 tranche yielding about 7.5% [30] [38].
Alphabet’s equity raise is worth sitting with. It is the tell for where this essay’s core versus periphery gradient actually runs. A company that can still raise $84.75 billion of equity at scale is choosing leverage, not resorting to it. CoreWeave, paying 9.75% with no equity market willing to underwrite it at that price, has no such choice.
Same boom, opposite balance sheets.
Summed across my Off-Balance-Sheet Debt Monitor’s eight tracked names: roughly $492 billion of on-balance-sheet debt, and, the iceberg’s submerged mass, approximately $1.9 trillion in off-balance-sheet exposure. Uncommenced leases signed but not yet on the books, purchase obligations, and SPV and VIE structures. Combined exposure of roughly $2.4 trillion, close to the GDP of Italy, assembled substantially within twenty-four months [30].
I am not the only one counting. In March 2026 the BIS published an analysis of exactly this structure, describing hyperscaler borrowing through special purpose vehicles and joint ventures as obligations “that are economically akin to debt but largely reside outside corporate balance sheets,” and warning of “new shock transmission channels” operating “via refinancing pressures at the vehicle level, procyclical shifts in private credit appetite or the activation of guarantees” [42].
Three months later, the BIS Annual Economic Report named an AI capex bust among the top threats to financial stability, warning that “disappointment in returns could turn the capex boom into a protracted investment bust” and that the resulting credit repricing “has the potential to be similarly disruptive” to 2008 [43].
When the central bankers’ central bank starts writing sentences like that, the off-balance-sheet question has stopped being a bear-blog preoccupation.
The Lenders Are Already Trying to Get Out
Here is the detail that should worry you most, and it is not in any bond prospectus.
In May 2026 the Financial Times reported that JPMorgan, MUFG and SMBC were all working to offload AI data-center debt as their exposures approached internal risk limits. JPMorgan and MUFG had spent more than six months attempting to distribute roughly $38 billion of construction debt tied to a single Oracle-leased Vantage project, and were prepared to move some of it at a discount [44].
Read that carefully. The banks that structured this market are struggling to syndicate it, on one deal, for half a year, at a markdown. Underwriters do not warehouse paper they can sell. The distribution machine is jamming, while the equity market still treats AI capex as a growth story.
In 1990, the first sign the land standard was breaking was not a default. It was that nobody wanted the collateral at the offered price.
Where It Cracks First
Readers of The Railway Hallucination will recognize the structure. The gradient matters because it maps precisely onto how the Japanese bubble actually broke.
The core hyperscalers remain enormously cash-generative. Amazon’s trailing operating cash flow runs near $149 billion, Alphabet’s near $165 billion. Their borrowing is a choice about scale and speed, not solvency. But radiating outward from that core is a periphery that lives on credit: Oracle at the investment-grade cliff-edge, CoreWeave at 855 basis points with 62% of its revenue concentrated in OpenAI, Nebius converting GPUs into loan collateral.
Financial history is unambiguous about where such structures fail first. Japan’s crisis did not announce itself at Mitsubishi Bank in 1990. It announced itself at the jusen.
Eight housing loan corporations, founded by the banks themselves in the 1970s, pivoted in the 1980s from home mortgages into speculative commercial property lending, much of it to borrowers with yakuza connections. By 1990 their combined loan book approached ¥13 trillion. When the accounting was finally done, bad loans exceeded 75% of their portfolios. They were effectively insolvent by 1991. The public bailout, ¥685 billion, was not approved until June 1996, and the resulting scandal, in which taxpayer money was seen to be rescuing organized crime, poisoned Japanese financial politics for years and helped delay every subsequent intervention [45] [46].
Five years between insolvency and admission. That is the lag this essay is about.
Subprime, likewise, broke at New Century and Bear Stearns’ hedge funds before it reached the majors. The AI credit cycle’s jusen layer has a name and a CDS spread. It is the neocloud periphery, and the market is already charging it distressed-adjacent premiums.
The Circularity
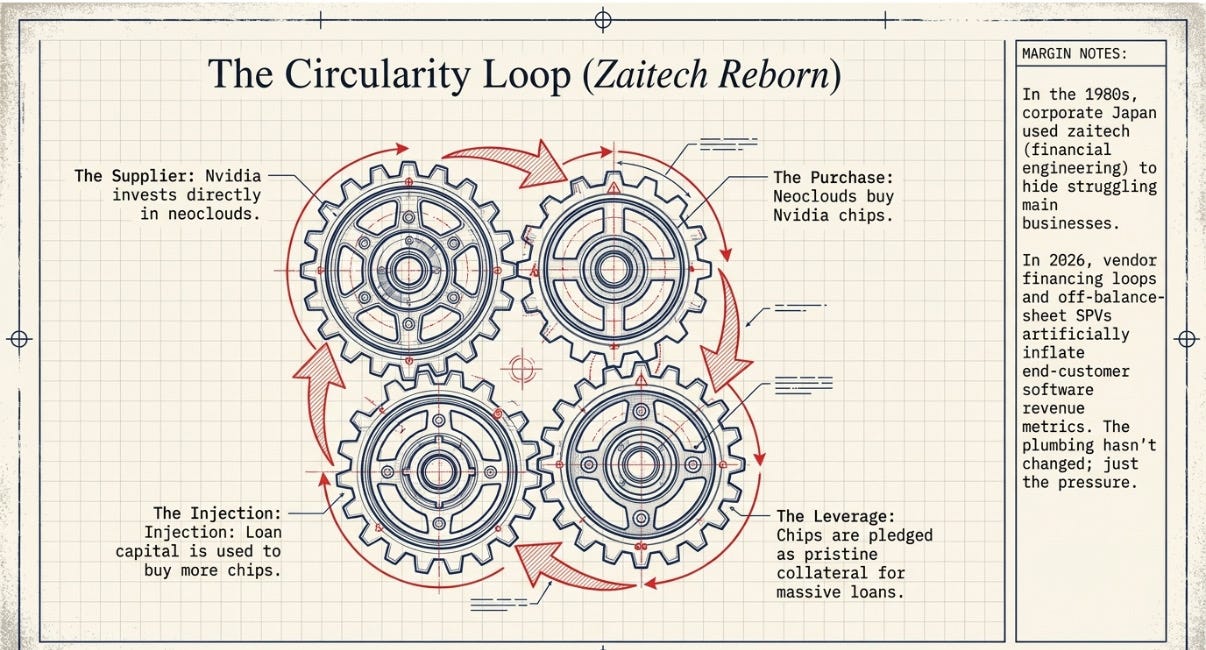
The deeper structural rhyme is circularity. In 1980s Japan, banks lent against land to borrowers who used the proceeds to buy more land, collateralized at prices the lending itself was inflating.
The corporate sector ran the same loop through the securities markets. A 1984 Ministry of Finance rule let companies run special share-trading accounts, tokkin, that sidestepped capital gains tax. Money in short-term speculative tokkin grew from roughly ¥2 trillion in 1983 to something on the order of ¥30 trillion later in the decade. A subspecies, eigyo tokkin, gave brokers full discretion to trade without waiting for client instructions, and came with an understood guarantee of returns around 8%. Compensating clients for losses was not outlawed until 1991 [47] [48].
This was zaitech, financial engineering, and at some major firms it stopped being a sideline. Olympus president Toshiro Shimoyama told the Nikkei in 1986: “When the main business is struggling, we need to earn through zaitech” [49].
Olympus is instructive because we know how that sentence ended. The company’s bubble-era losses were hidden through tobashi transfers for two decades and only surfaced in 2011, when roughly $2 billion of concealed losses detonated one of the largest accounting scandals in Japanese corporate history [50].
Twenty-two years between the loss and the disclosure.
Now look at 2026. Nvidia invests in the neoclouds that buy its chips. The neoclouds pledge those chips as collateral to borrow the money to buy more. Meta leases capacity to Anthropic while borrowing off-balance-sheet to build it. A growing share of the sector’s reported economics consists of financial engineering, through SPVs, vendor financing, and capacity pre-purchases, rather than end-customer software revenue.
I wrote about this circular financing loop in detail in The New Mississippi. The plumbing hasn’t changed. The pressure most definitely has.
The land standard has a successor. The compute standard: credit created against the collateral of hardware whose value is assumed never to fall, in an industry where the hardware depreciates in four years.
Why Leverage Is the Whole Argument
Here is the part that turns this essay from an analogy into a claim you can test.
Òscar Jordà, Moritz Schularick and Alan Taylor assembled a database covering 17 advanced economies over 140 years and asked a question directly relevant to every argument about whether AI is a bubble: does it matter how a bubble is financed? Their answer, in “Leveraged Bubbles,” is that it is close to the only thing that matters.
“When not accompanied by below average credit growth, equity bubbles appear to have virtually no effect on the depth of the recession and the speed of the recovery... Credit-financed housing price bubbles have emerged as a particularly dangerous phenomenon.” Source: Jordà, Schularick & Taylor (2015) [51]
Read the first clause again, because it is the most useful sentence in the bull case. An equity bubble that deflates without a credit boom behind it is, historically, nearly harmless to the real economy. Prices fall, wealth evaporates, the index eventually recovers, and output barely notices. Their companion work established credit growth as the single best predictor of which financial booms end in genuine crises [52].
This is why the 2023 to 2024 framing of the AI trade was, on its own terms, reasonable. A capex boom funded from operating cash flow and equity issuance is a valuation risk. If it deflates, shareholders eat it, and the damage stops there.
That is no longer the boom we are in.
The transition documented above, from cash-funded to debt-funded in eighteen months, is not a detail of financing mechanics. By the best available evidence on 140 years of bubbles, it is the variable that separates a drawdown from a crisis. Japan is the archetype the literature keeps returning to precisely because its bubble was collateralized bank credit rather than equity, which is why its aftermath lasted decades rather than quarters.
The capital deployed cannot earn its cost of capital.
That sentence is the one thing I want readers to take away from this essay. I wrote it in The Railway Hallucination about the 1840s. It applies here.
The July correction, properly absorbed, does not weaken this thesis. It removes the last firewall between its two halves. If AI capex were genuinely equity-and-cash-flow funded, Japan’s normalization would threaten valuations but not solvency. A repricing, not a reckoning. A $2.4 trillion debt-and-lease stack is a different object entirely. It has maturities, covenants, collateral haircuts, and a refinancing schedule, all of which now must clear a world in which the anchor of global duration is being hauled up from the seabed of the Tokyo bond market.
ACT V: THE NECESSARY BUBBLE AND THE VAULTS
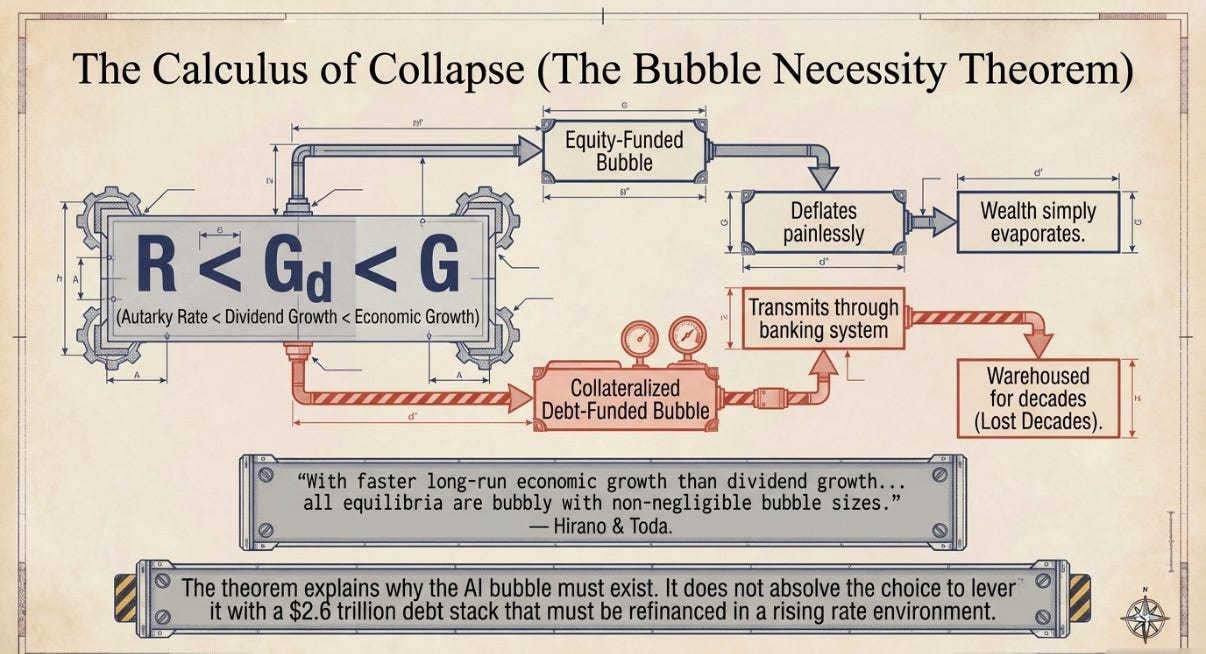
It would be easy to read everything above as a morality tale about greed. The most unsettling recent scholarship says something different. The bubble may not be a moral failure at all, but a mathematical necessity. Which changes where the danger actually lies.
Tomohiro Hirano and Alexis Akira Toda posited what they call the Bubble Necessity Theorem. They argue that in economies where long-run growth G outpaces the growth of dividends Gd, with the counterfactual autarky interest rate R below both, formally R < Gd < G, then asset prices cannot equal fundamentals in any equilibrium. Bubbles are not one possible outcome. They are the only outcome.
“With faster long-run economic growth (G) than dividend growth (Gd) and counterfactual long-run autarky interest rate (R) below dividend growth, all equilibria are bubbly with non-negligible bubble sizes relative to the economy.” Source: Hirano & Toda (2025) [53]
This is a stronger result than it first appears, and it is worth being precise about why. Economists have known since Samuelson in 1958 that bubbles are possible in general equilibrium. Hirano and Toda establish that under a specific and identifiable condition they are unavoidable, and they do it across every model class they tried, not one convenient one. The condition arises whenever technological change is unbalanced. In their words, technological innovations that enhance overall productivity will inevitably generate asset price bubbles [53].
Their own historical exhibit is 1980s Japan. In 1988, Taro Kaneko, a former Ministry of Finance official then serving as president of Marusan Securities, wrote to his own employees:
“The total land value in Japan is estimated to be 4 times of U.S. The land area is 1/25, so the unit price is really 100 times. The land price of the Imperial Palace is about the same as California. Even if the Japanese economy is booming, we cannot expect such an abnormal disparity to be sustainable. Moreover, the Japanese population will decline. Therefore, you should refrain from purchasing housing for the time being.” Source: Taro Kaneko, 1988 [54]
A securities-firm president telling his staff not to buy houses, at the top, in writing.
The system did not lack information. It lacked a mechanism by which information could outweigh the carry.
Applied to 2026, the theorem cuts both ways, and you have to hold both edges. On one side, it dignifies the AI boom. If compute-augmenting technological progress is real, and it is, then elevated asset prices attached to it are not collective madness but the equilibrium price of financing an unbalanced transition. A June 2026 arXiv paper asking “Boom, Bubble, or Buildout?” and a recent SSRN paper by Breydo on AI infrastructure as an emergent systemic risk mark the migration of this question from Substack to the academy [55] [56].
On the other side is the thing the model does not contain. There are no banks in it. No collateral. No haircuts. No depreciation.
The Hirano-Toda framework is about the intertemporal general equilibrium price of a long-lived claim, and it is silent on how anyone financed buying it. That silence is not a flaw in their work, which was never trying to answer the question. But it means the theorem cannot be used to reassure anyone about the consequences of the bubble it proves must exist.
And on consequences, the evidence from Act IV is unambiguous. A necessary bubble funded by equity deflates. Wealth evaporates, output barely moves, life goes on. A necessary bubble funded by collateralized debt, the land standard then, the compute standard now, transmits its deflation through the banking system and gets warehoused for decades.
The theorem explains why the bubble exists. It says nothing about the choice, made freshly in the last eighteen months, to lever it. That choice is the whole ballgame.
Which returns us, finally, to the vaults.
The enduring image of Japan’s reckoning is not the crash itself but the decade after. Ten thousand paintings, the van Goghs and Renoirs and Picassos of the zaitech years, locked in bank vaults as seized collateral, marked at twenty cents on the dollar, untouched and out of public view [18].
Collateral is only as good as the market that must absorb it.
The question that should keep AI lenders awake is the one Mitsui Trust’s workout officers confronted in 1995. What, exactly, do you do with the collateral when everyone who could buy it is selling too?
What the GPU Is Actually Worth
A repossessed Renoir at least holds its beauty. A repossessed H100, four years into a product cycle Nvidia refreshes every twelve to eighteen months, is a painting that fades while you hold it.
The secondary market has begun answering the question. Used H100 SXM5 cards that sold for around $40,000 in late 2023 were trading in a range of roughly $12,000 to $22,000 by 2026, even as new cards still listed at $25,000 to $40,000 [57]. Market data compiled by Silicon Data shows used H100s clearing at a median of roughly 61% of the contemporaneous new price in 2024, with pricing that does not decay smoothly but resets in step-changes on each architecture launch, and a pronounced value cliff around the 36-month mark. Rental economics tell the same story from the other direction. H100 rental rates fell from roughly $8 per hour to under $3.50, and AWS cut P5 instance pricing by around 44% in a single move in June 2025 [58].
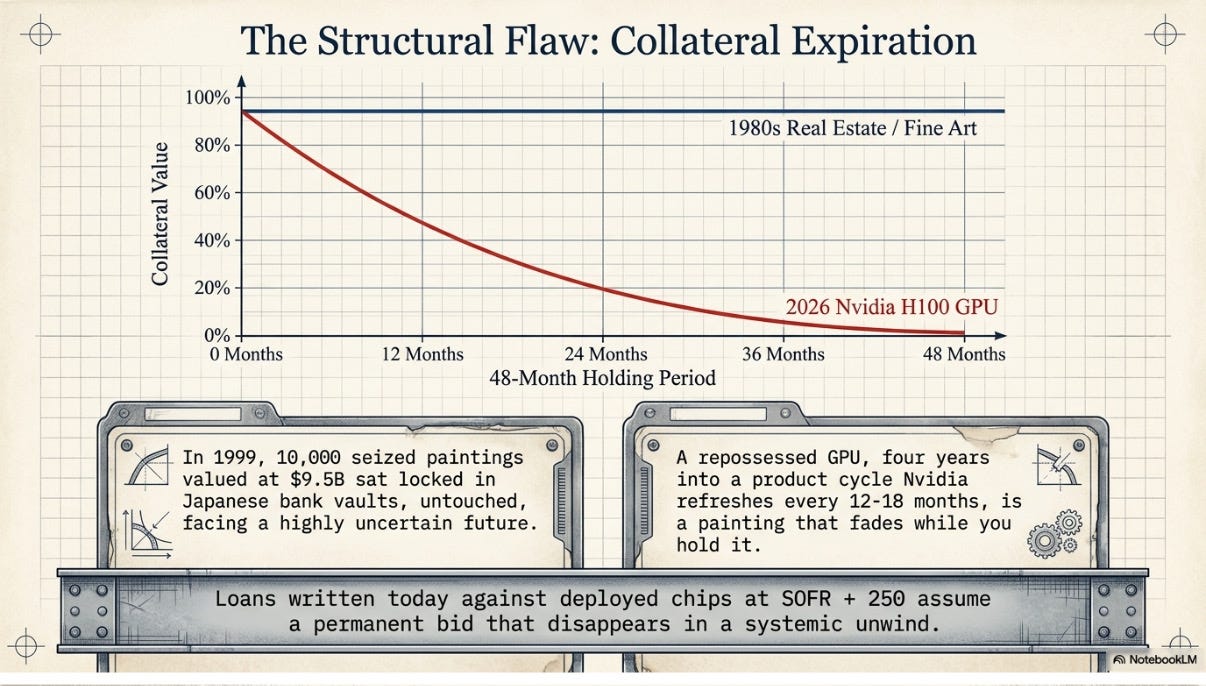
Source: CloudZero, Silicon Data H100 Rental Index]
This is industry data, not peer-reviewed research, and there is a real bull counterargument that inference workloads keep older silicon economically useful for five to seven years. That is probably true.
But it is beside the point for a lender. GPUs are being pledged as collateral at valuations that reflect frontier training demand. If their residual value depends on redeployment into lower-value inference work, then the collateral is worth materially less than the advance rate assumes, precisely in the scenario where the borrower needs to sell it.
The accounting fight over this is now happening in public, and it is unusually clarifying. In 2025 Amazon shortened the useful life it assigns to a subset of its servers from six years to five, taking an accelerated depreciation charge of roughly $920 million. In the same period Meta extended its assumed server life to five and a half years, reducing its depreciation expense by roughly $2.9 billion. Microsoft has moved from four years to six [59].
Same chips. Same vendor. Same product cycle. Opposite accounting.
Michael Burry put the aggressive reading of this in November 2025, arguing that understating depreciation by extending useful life of assets artificially boosts earnings, calling it one of the more common frauds of the modern era, with an estimate that hyperscalers were understating depreciation by roughly $176 billion across 2026 to 2028 [60].
That $176 billion is his own estimate and I would not put weight on the precise figure. But the mechanism does not depend on his arithmetic. The useful-life assumptions are disclosed in audited filings, the disagreement between Amazon and Meta on identical hardware is a matter of public record, and every year added to an assumed useful life flatters current earnings while deferring the write-down.
The GPU depreciation schedule is the art market of this cycle. And the loans being written against it at SOFR plus 250bps assume the paint stays wet forever.
The Precedent Nobody Wants to Discuss
There is a closer historical analog than Japanese art, and it involves lenders rather than collectors.
Between 1996 and 2001, American telecom companies issued more than $500 billion of new bonds to build fiber optic networks. The technology was real. The demand forecasts were not absurd. And the collateral was a physical, productive, long-lived asset in the ground.
Global Crossing spent roughly $15 billion building fiber networks around the world and never turned a profit in its entire existence. It filed for Chapter 11 on January 28, 2002, listing $22.44 billion in assets against $12.39 billion in debts, then the fourth-largest bankruptcy in American history [61]. WorldCom followed, at the time the largest ever. Qwest and 360networks joined them. By 2004, wholesale long-haul prices had fallen more than 50% year over year, and only around one-tenth of the fiber that had been laid was ever lit.
The fiber is still there. Most of it is still dark. The companies that borrowed to install it are gone, and the lenders who took it as security discovered that a purpose-built technology asset has almost no value to anyone who is not already in the business, at exactly the moment everyone in the business is distressed.
This is what the collateral literature predicts. Assets serving as both productive input and collateral create a doom loop where a shock lowers prices, shrinks borrowing capacity, forces sales, and lowers prices again. The mechanism Kiyotaki and Moore formalized [62], that Gorton and Metrick documented running through repo haircuts in 2008 [63], and that Adrian and Shin showed is procyclical, expanding into rising collateral values and collapsing into falling ones [64]. The magnitude of the amplification is contested. The direction is not.
Haircuts widen when collateral values fall in the same way they shrink as collateral values rise. That is not a market failure. It is the mechanism working exactly as designed, and it is why collateralized booms end faster than anyone underwrote for.
As I argued at length in The Railway Hallucination, there is a decisive disanalogy between durable infrastructure and silicon. Railway track depreciates at 1 to 4% per year. Fiber lasts decades. In comparison, Nvidia ships a new architecture every twelve to eighteen months. The surviving infrastructure of the AI boom will be the power, the land, the data center shells, the cooling, the fiber. Not the GPU silicon that absorbed most of the capital.
The buildings will endure. The machines inside them may be two generations obsolete before the debt that financed them matures.
THE CMSS SCORECARD
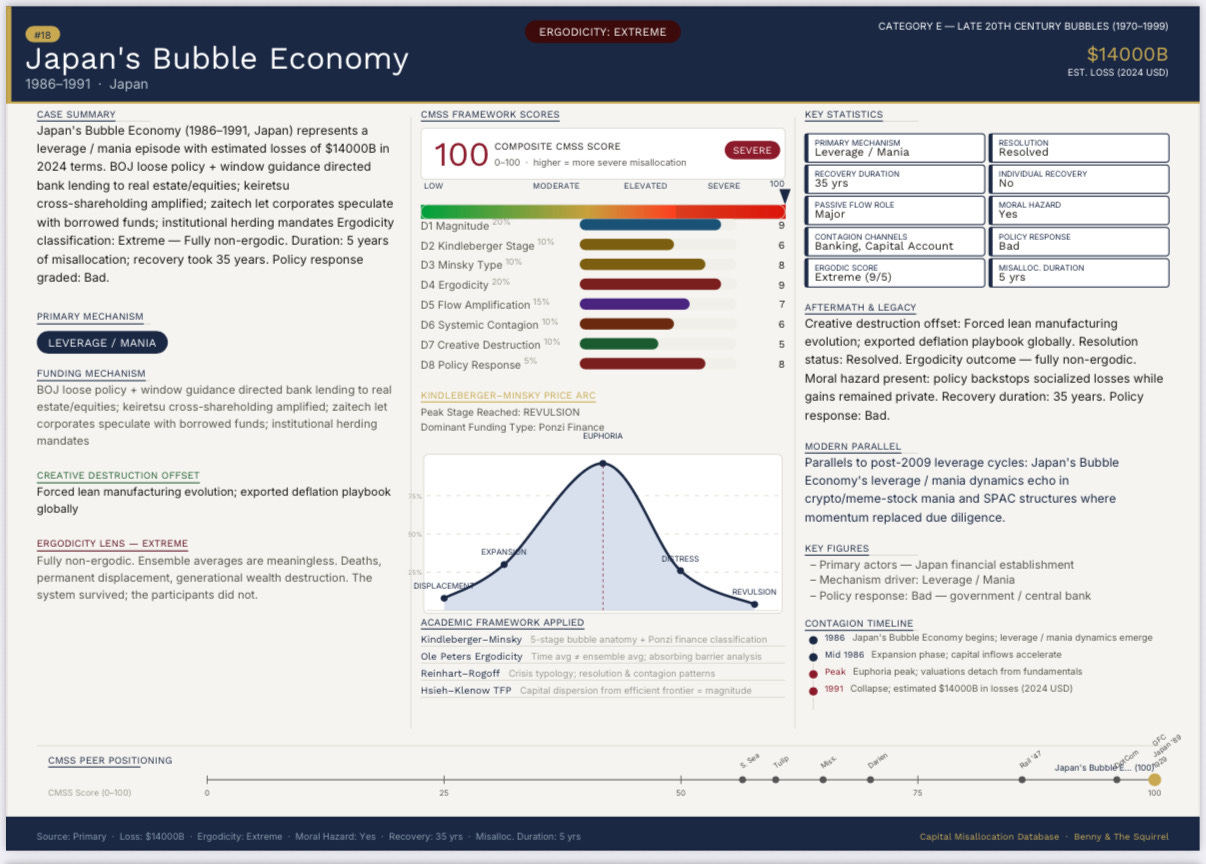
Composite scores are normalized against the full 56-case database, where Japan’s case anchors the ceiling at 100. They are not a raw weighted average of the eight dimension scores above. For readers who want that raw calculation as a cross-check, weighting each dimension score directly by the percentages shown yields 75.5 for Japan and 55.0 for the AI Boom, the same directional gap under either method.
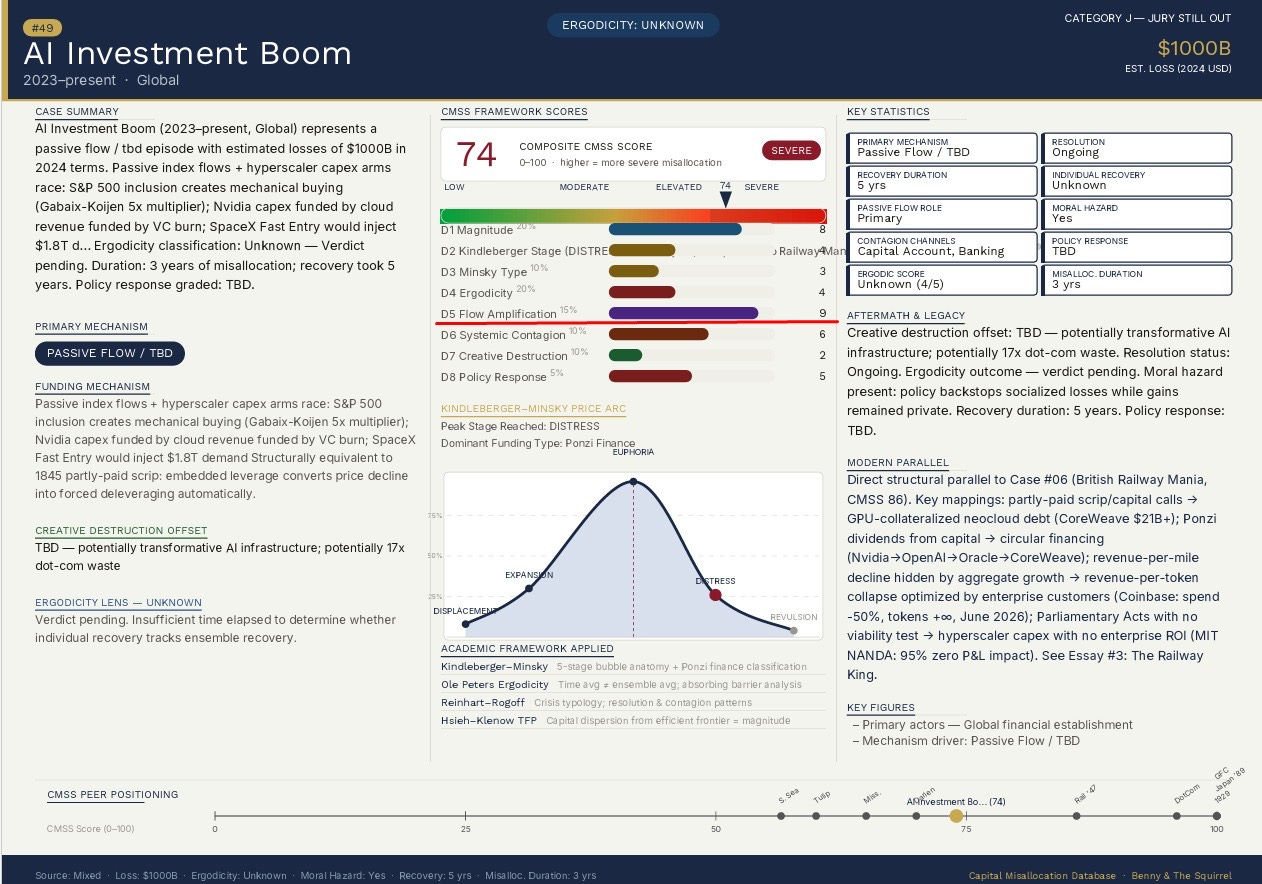
Three things jump off this table.
First, Japan at a CMSS 100 is at the ceiling. It shares that score only with the 1929 Crash, the GFC, the Latin American Lost Decade, and the COVID Everything Bubble. This is the company the AI Boom would join if D3 and D4 continue their trajectory.
Second, the AI Boom’s D5 Flow Amplification score of 9 exceeds Japan’s 7. It is also the single highest Flow Amplification reading in all 56 cases in the database, above the Dot-Com and above the GFC. That score reflects the passive-flow machinery I detailed in The South Sea Machine. The Gabaix-Koijen 5-to-8x price-impact multiplier, index-inclusion forced buying, the concentration that turns every 401(k) into a leveraged bet on this one cycle earning its cost of capital. Japan’s bubble did not have index funds. If it had, it would have scored higher.
Third, the gap on D3 (Minsky: 8 vs 3) is the gap to watch. Japan was deep in Ponzi finance by its late stages. The AI complex has been transitioning from Speculative to Ponzi over the last 18 months, exactly the dynamic documented in Act IV. Every new circular-financing disclosure, every off-balance-sheet SPV, every GPU-collateralized loan compresses this gap. If D3 moves to 6 and D4 moves to 6, which is where the next twelve months of data will likely take them, the composite moves to the high 80s.
The CMSS does not yet put the AI Boom close to the Japan Bubble’s class. But the vector is closing the gap faster than any prior case in the database at the same stage.
ACT VI: WHAT THE FINAL BILL LOOKS LIKE
This essay’s thesis, stated plainly, is not that Japan is about to default, nor that the AI trade collapses tomorrow.
The claim is that the losses of 1989 were never paid. They were refinanced, in three great tranches, across 36 years, and the refinancing vehicle is now being unwound for the first time. The bill is being re-invoiced. And the counterparty on the new invoice is not Japan. It is everyone who borrowed the deferral.
Three scenarios bracket the endgame, in ascending order of severity.
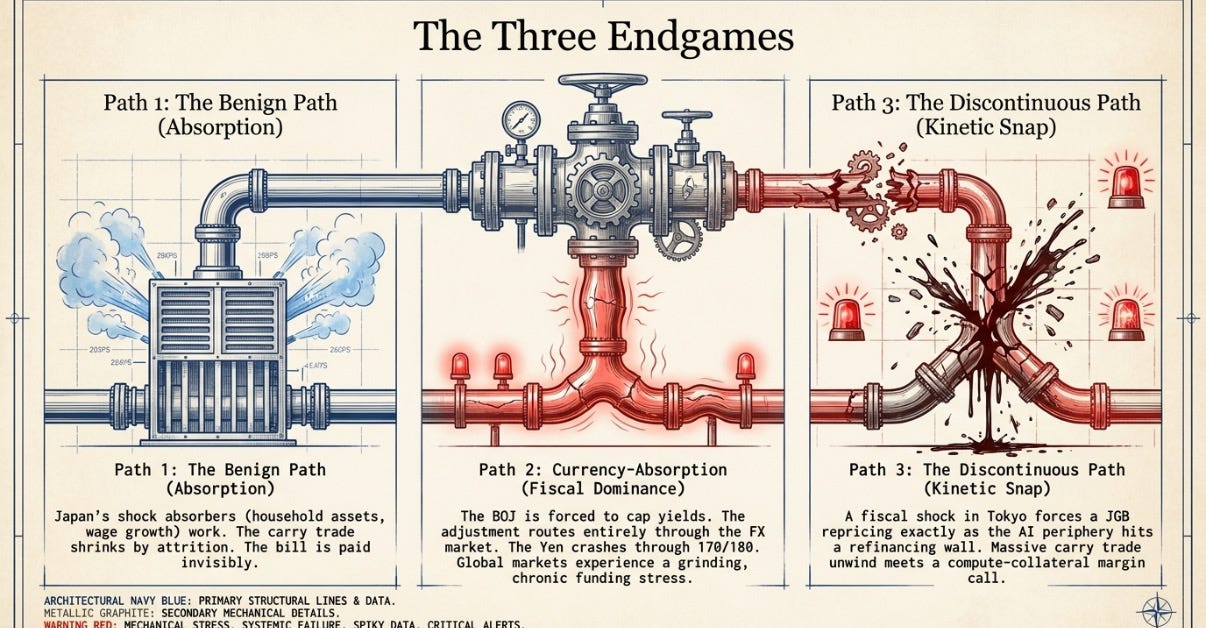
The benign path, which remains the base case. Japan’s genuine shock absorbers do their work. NISA drives a rotation of ¥2,200+ trillion in household financial assets into risk. Wage growth above 5% for a third consecutive shunto. A central bank that retains the legal and practical capacity to cap any disorderly move in yields. Normalization proceeds, the yen strengthens gradually, the carry trade shrinks by attrition, and the AI credit stack refinances at higher but survivable rates. The bill is paid in installments, invisibly, as it has been for decades.
The currency-absorption path. Fiscal dominance hardens. The government leans on the BOJ, real rates are held below what the debt stock requires, and the adjustment routes through the exchange rate. The yen through 170, then 180. Imported inflation taxing Japanese households to pay, one more time, for 1989. Global markets experience this as chronic funding stress. Think of it as a persistent, grinding version of August 2024.
The discontinuous path. The two meters of Act II converge. A fiscal shock in Tokyo, a failed auction or a blueprint too far, forces a genuine JGB repricing precisely as the AI periphery hits its first refinancing wall. The carry trade unwinds at 2026 scale rather than 2024 scale. And the most levered claims on the compute standard discover, as the jusen did, that the collateral bid disappears exactly when it is needed.
The probability-weighted truth lies between the first two. But the third is no longer unthinkable. And the CDS market has stopped pricing it as if it were.
What makes this cycle historically distinctive, and what the zombie literature illuminates one last time, is the direction of the externality.
Japan’s original sin was domestic forbearance. Banks kept insolvent borrowers alive. Japanese savers and workers paid through two decades of stagnation whose human ledger reads like a war memorial. It created an employment ice age that stranded a generation, 613,000 middle-aged hikikomori, the madogiwazoku seated by their windows with nothing to do, karoshi claims filed by widows [65] [66].
The suppression that managed those losses simultaneously ran, for twenty-five years, as a subsidy to global risk-taking.
Zombie lending went global. The carry trade is forbearance as an export product, and every asset on earth priced off a zero yen rate is, in the term’s precise economic sense, partially zombie-funded.
The BOJ’s normalization is therefore not a Japanese domestic story. It is the slow withdrawal of the world’s cheapest funding leg. A margin call issued in Tokyo, but payable everywhere.
And so the essay ends where it began, at the same keiretsu, because no institution embodies the full circuit like Mitsubishi.
In 1989, Mitsubishi Estate bought an 80% stake in Rockefeller Center for roughly $1.4 billion. The single most symbolically freighted purchase of the entire bubble, the moment Americans decided Japan was buying their country. Six years later it defaulted on the mortgage and walked away [67].
In September 2008, in the week Lehman died, MUFG bought 21% of Morgan Stanley for $9 billion, recycling into Wall Street’s rescue capital that had itself been rebuilt from the wreckage of Japan’s own collapse [68].
And on July 17, 2026, the same institution extended another GPU-collateralized facility, following the landmark CoreWeave deal it had already helped structure four months earlier. A full 36 years after its loan officers last watched a nation’s collateral assumptions dissolve.
Mitsubishi bought the trophy only to lose it. Then they rescued the rescuer. Now it underwrites the machines.
Nobody alive has better institutional memory of what happens when the asset securing the loan is the asset inflating the boom. That MUFG chose to lead this market anyway is either the strongest bull case for the compute standard, or the most poetic confirmation that in finance the same lesson is never learned twice by the same balance sheet. It is only survived twice.
The land was supposed to be different. The compute is supposed to be different. The bill, when it comes, is always the same.
And this time, for the first time in thirty-six years, it is in the mail.
WHAT I’M WATCHING
This essay is wired to a living data source, the Off-Balance-Sheet Debt Monitor, and its thesis is updated week by week, ironically by an AI agent. I have identified five gauges that will tell the story before the headlines do.
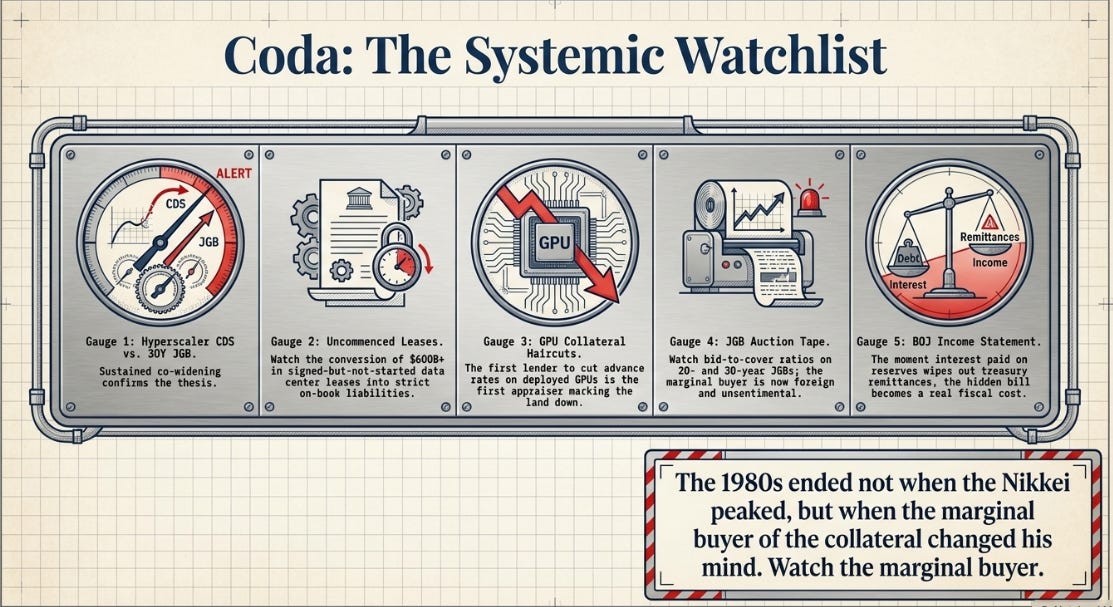
1. The Two Meters. Hyperscaler CDS and 30-year JGB yield. Sustained co-widening confirms the thesis. Divergence falsifies it.
2. The BOJ’s Income Statement. The quarter in which interest paid on reserves fully offsets remittances to the treasury is the quarter the consolidated bill becomes a line item in Japan’s budget.
3. Uncommenced Lease Commencements. The roughly $600 billion of signed-but-not-started data center leases in the monitor converts to on-book liabilities on a schedule. Watch whether commencements accelerate (conviction) or get renegotiated (retreat).
4. Collateral Haircuts and Syndication. Two halves of the same signal. Advance rates on facilities like Nebius’s, currently written near SOFR plus 250, are the compute standard’s land appraisals. The first lender to cut advance rates against deployed GPUs is the first appraiser marking Ginza down. And watch whether the arrangers can actually distribute the paper. That $38 billion Vantage block sitting on bank balance sheets for six months is the early warning, and it is already flashing.
5. The Auction Tape in Tokyo. Bid-to-cover ratios on JGB auctions, where the marginal buyer is now foreign and unsentimental.
The 1980s ended not when the Nikkei peaked, but when the marginal buyer of the collateral changed his mind.
Watch the marginal buyer.
Cheers,
Benny
First time here? I’ve been on the buy side for over two decades. Capital Misallocation™ is a 50-essay series chronicling where the money’s going that shouldn’t be, the implications on a time-weighted rather than ensemble-average basis, and what happens when the music stops. We believe markets and systems are non-ergodic and that everything obeys power laws. Below the paywall: the decks behind everything above, a few sites I’ve built, and my WhatsApp channel of professional investors, PMs, traders, and LPs.
Extra materials below the paywall: the Railway Mania deck, the CMSS Case chartbook of all 56 cases, the CMSS methodology, the AI ROI deck, the convexity trade in the AI Capex boom, and access to the AI Capex Monitor website.
Nothing here is investment advice. Contact your financial advisor before making investment decisions, and do your own work.
APPENDIX A: LPPL DIAGNOSTICS
The LPPL fits referenced in Act II follow the Johansen-Ledoit-Sornette log-periodic power law framework [32] [33].
Nikkei 225 fit (08/2024 -06/2026 peak): Analysis passes the strict diagnostic filter for a qualified bubble at R² = 0.96.
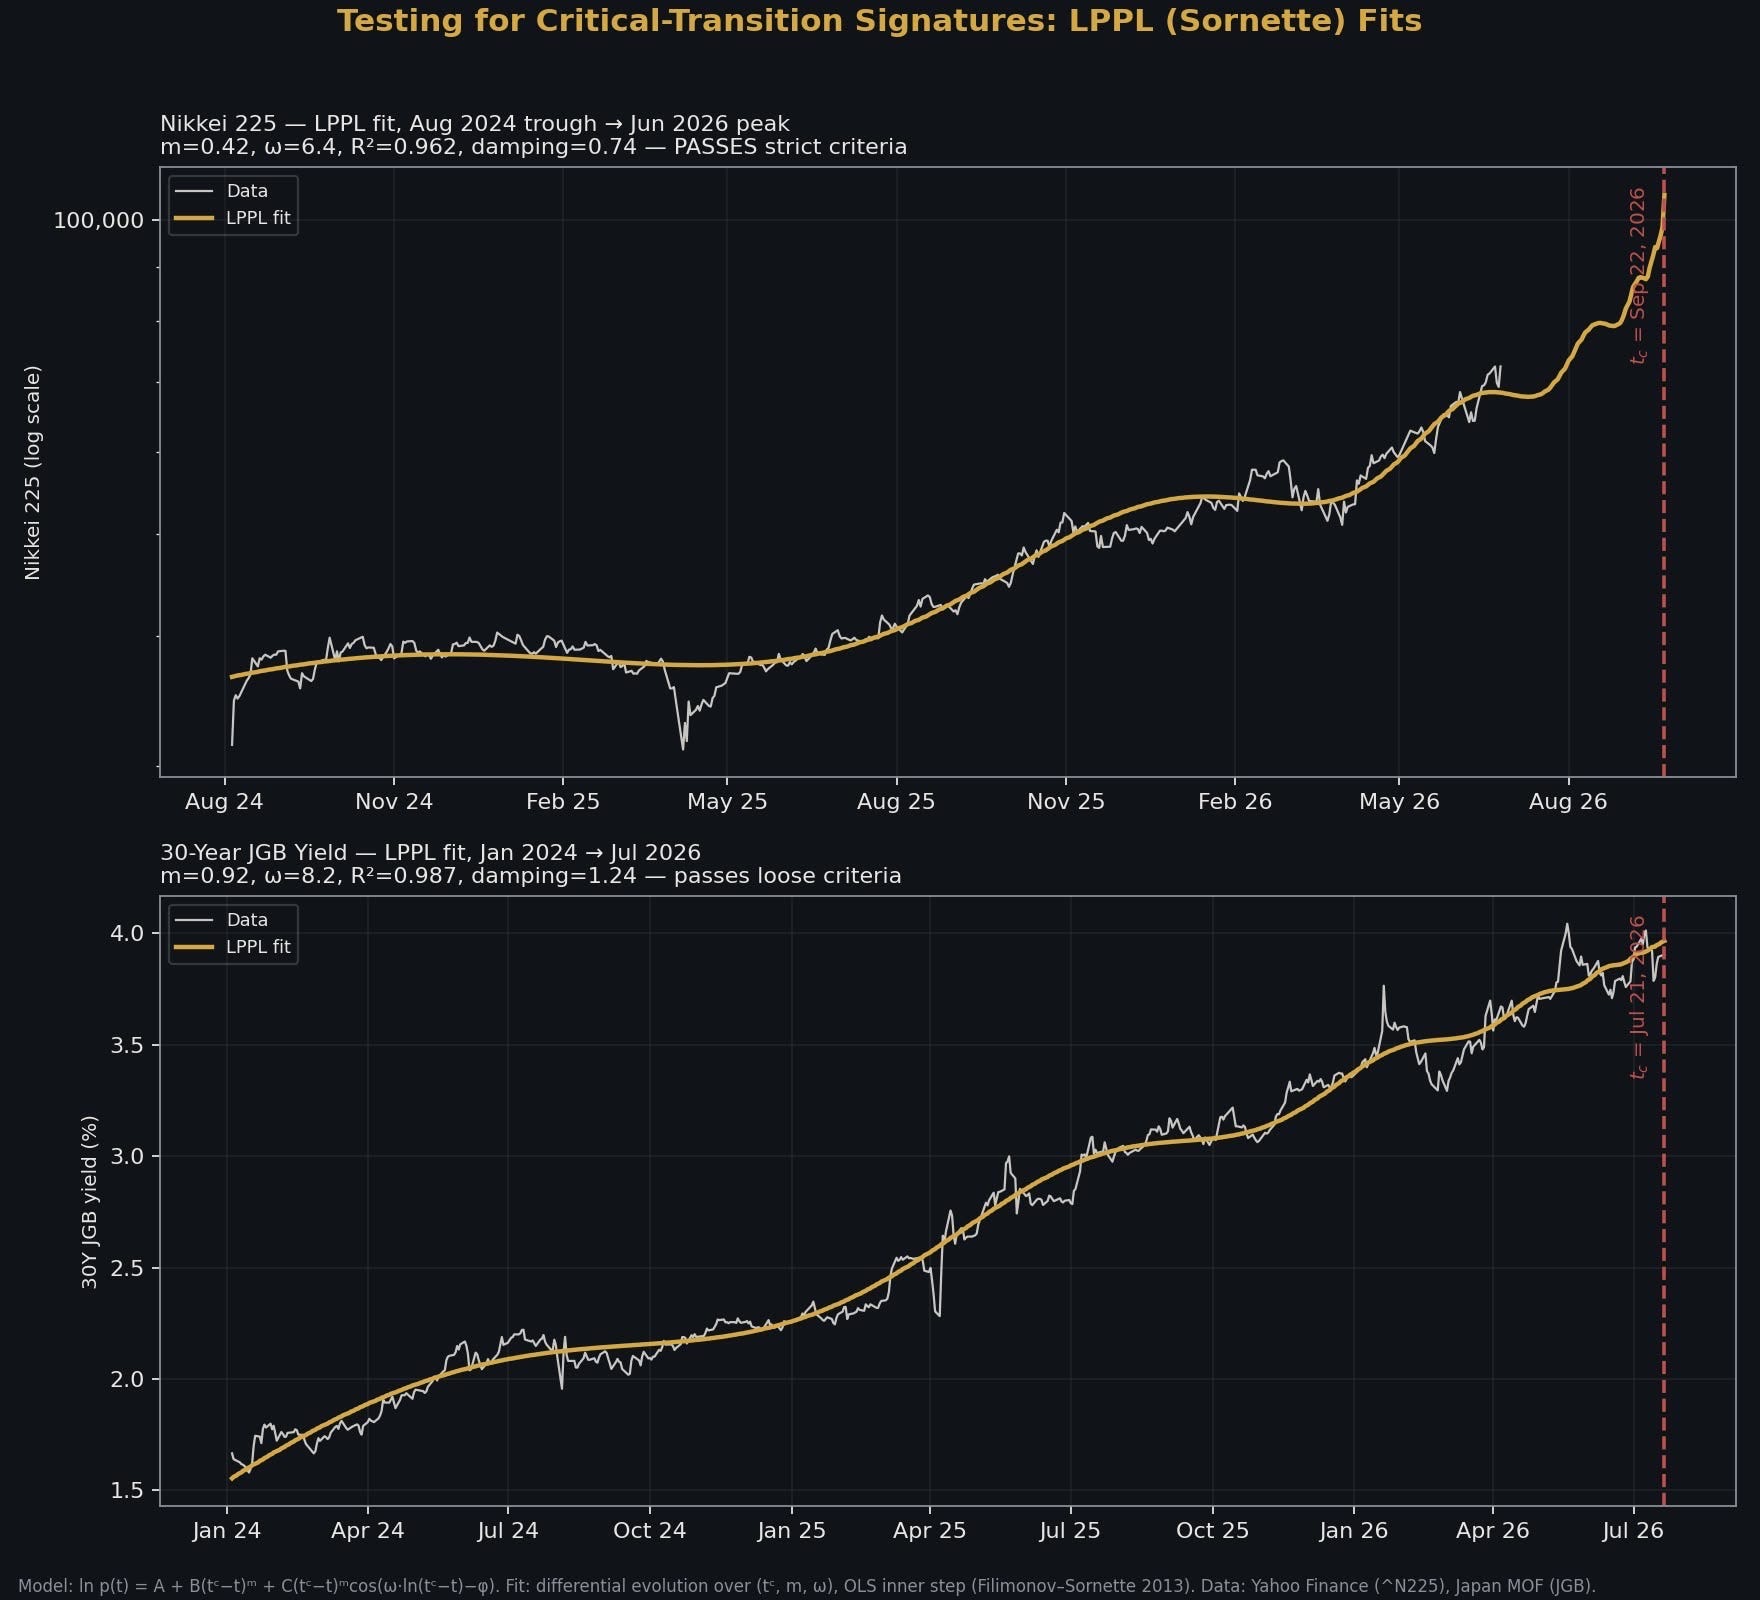
30-year JGB fit: Analysis shows log-periodic structure, but its fitted critical time has not stabilized across estimation windows, which is why no date is published for it here.
KEY SOURCES
If you read nothing else from the reference list, read these.
Jordà, Schularick & Taylor, “Leveraged Bubbles” (2015). Why credit-financed bubbles are the dangerous kind.
Caballero, Hoshi & Kashyap, “Zombie Lending and Depressed Restructuring in Japan” (2008). The canonical account of how the losses were warehoused.
Nakaso, “The Financial Crisis in Japan during the 1990s” (BIS Papers No. 6, 2001). The BOJ crisis manager’s own account, written from the front line.
Werner, Princes of the Yen (2003). Window guidance and the case that the crisis was directed, not accidental.
Hirano & Toda, “Bubble Necessity Theorem” (2025). Why unbalanced tech growth makes bubbles unavoidable.
BIS, “Financing the AI Infrastructure Boom” (March 2026). The official anatomy of off-balance-sheet borrowing.
BIS, Annual Economic Report 2026. Names the AI capex bust a top financial-stability risk.
Okina, Shirakawa & Shiratsuka, “The Asset Price Bubble and Monetary Policy” (2001). The Bank of Japan’s own post-mortem.
BIS Bulletin No. 90, “The Market Turbulence of August 2024.” The carry trade dress rehearsal, quantified.
Felson, “Closing the Book on Jusen” (1997). Legal history of the periphery that cracked first.
Kiyotaki & Moore, “Credit Cycles” (1997). The collateral doom loop, formalized.
Breydo, “Closed Circles: Is AI Infrastructure the Next Systemic Risk?” (2026). The circularity critique, formalized.
REFERENCES
[1] Japan Hana, “Japan Land Prices Rise for Third Straight Year” (Kyukyodo/Ginza valuations), July 3, 2018.
[2] Reuters, “Japan’s Crazy 1980s Bubble a Dim Memory as Nikkei Hits Record High,” February 22, 2024.
[3] Kazumasa Iwata, “Housing and Monetary Policy in Japan,” BIS Review, 2007.
[4] Collateral composition of Japanese secured bank lending; Nikkei database study on real estate as perceived safe collateral during the bubble period.
[5] MUFG Bank, “The Origins of Our Bank”; Nippon.com, “Heisei Blues: The Post-Bubble Struggles of Japan’s Financial Sector,” March 6, 2019.
[6] Nebius Group, “Nebius Raises $775 Million in First Secured Debt Financing to Accelerate Global Buildout,” July 17, 2026; Nebius Group N.V. Form 6-K.
[7] CoreWeave, “CoreWeave Closes Landmark $8.5 Billion Financing Facility, Achieving First Investment-Grade Rated GPU-backed Financing,” March 30, 2026.
[8] Reuters, “Japan’s Nikkei Ends at Record High, Surpassing 1989 Peak,” February 22, 2024.
[9] Yahoo Finance / Reuters, Nikkei 225 historical data and July 2026 correction coverage.
[10] Global market capitalization rankings, year-end 1989. [SOURCE TO BE CONFIRMED: see note below]
[11] Nikkei 225 valuation metrics, year-end 1989 (P/E and dividend yield). [SOURCE TO BE CONFIRMED: see note below]
[12] Hiroshi Nakaso, “The Financial Crisis in Japan during the 1990s: How the Bank of Japan Responded and the Lessons Learnt,” BIS Papers No. 6, Bank for International Settlements, October 2001. https://www.bis.org/publ/bppdf/bispap06.pdf
[13] IMF World Economic Outlook database, general government gross debt, Japan, 1980 to 2026; IMF DataMapper.
[14] Bank of Japan, current account balances and remittance mechanics; IMF, “Japan: 2026 Article IV Consultation, Press Release and Staff Report.”
[15] Ricardo Caballero, Takeo Hoshi & Anil Kashyap, “Zombie Lending and Depressed Restructuring in Japan,” American Economic Review 98(5), 2008.
[16] Kunio Fukao, cumulative loan loss estimates (April 1992 to March 2002), as cited in Hoshi & Kashyap.
[17] Bank of Japan, “Japan’s Nonperforming Loan Problem,” Financial System Report, October 2002.
[18] Japan Inc, “The Art of a Failed Economy,” December 1999.
[19] Los Angeles Times, “Tokyo Magnate Bought 2 Paintings,” May 18, 1990.
[20] Newsweek, “Ashes to Ashes, But Not With Your Van Gogh,” May 26, 1991.
[21] The New York Times, “Big Japanese Securities Firm Falls, Putting the System on Trial,” November 24, 1997.
[22] Paul Krugman, “It’s Baaack: Japan’s Slump and the Return of the Liquidity Trap,” Brookings Papers on Economic Activity 2:1998.
[23] Ben Bernanke, “Japanese Monetary Policy: A Case of Self-Induced Paralysis?”, Princeton University, December 1999.
[24] Kunio Okina, Masaaki Shirakawa & Shigenori Shiratsuka, “The Asset Price Bubble and Monetary Policy: Japan’s Experience in the Late 1980s and the Lessons,” BOJ IMES Monetary and Economic Studies 19(S-1), 2001.
[25] Bank of Japan policy announcements, March 2024 to June 2026.
[26] Japan Ministry of Finance, JGB interest rate data; FRED series IRLTLT01JPM156N; May to July 2026 auction coverage.
[27] Richard A. Werner, Princes of the Yen: Japan’s Central Bankers and the Transformation of the Economy, M.E. Sharpe (East Gate), Armonk NY, 2003. ISBN 978-0765610492. Quantity Theory of Credit developed further in Werner, New Paradigm in Macroeconomics, Palgrave Macmillan, 2005.
[28] Reuters, “Japan Bond Jitters Overshadow Takaichi’s Debut Economic Blueprint,” July 21, 2026 (includes the Seiji Adachi quotation).
[29] Bloomberg, “Tech Giants’ Bonds Are Trading Like Junk as AI Spending Balloons,” December 2025; Sage Advisory, “Oracle’s Debt-Fueled AI Push,” 2026.
[30] Off-Balance-Sheet Debt Monitor (weekly update, July 2026): CDS levels, issuance detail, and off-balance-sheet exposure for AMZN, GOOGL, MSFT, META, ORCL, CRWV, NBIS, SpaceX. On-balance-sheet debt $492.2B; off-balance-sheet ~$1.896T; combined ~$2.4T.
[31] The New York Times, “Market Place; Investors Relish Bet Against Japan,” January 15, 1990.
[32] Anders Johansen & Didier Sornette, “Financial ‘Anti-Bubbles’: Log-Periodicity in Gold and Nikkei Collapses,” International Journal of Modern Physics C 10(4), 1999.
[33] Vladimir Filimonov & Didier Sornette, “A Stable and Robust Calibration Scheme of the Log-Periodic Power Law Model,” Physica A 392(17), 2013.
[34] Bank for International Settlements, Bulletin No. 90: “The Market Turbulence and Carry Trade Unwind of August 2024,” August 2024.
[35] IMF, Global Financial Stability Report, April 2026, Chapter 1.
[36] CFTC Commitments of Traders, JPY futures net non-commercial positioning, mid-2026.
[37] The Norinchukin Bank, FY2024 results (year ended March 2025) and CEO message; Reuters coverage of the ¥10 trillion foreign bond disposal announced June 2024.
[38] Yahoo Finance / Bloomberg, “AI Data Center Splurge Sends Tech Titans to Bond Market,” July 17, 2026.
[39] The Washington Post, “Big Tech’s Record Borrowing Spree for AI,” January 23, 2026.
[40] Bloomberg, “JPMorgan Sees Record $1.81 Trillion of High-Grade Bond Sales in 2026,” November 14, 2025.
[41] Hyperscaler bond issuance data, Dealogic and BofA, as compiled in IESE Insight and BIS commentary, 2026.
[42] Egemen Eren, Ilhyock Krohn & Karamfil Todorov, “Financing the AI Infrastructure Boom: On- and Off-Balance Sheet Borrowing,” BIS Quarterly Review, March 2026.
[43] Bank for International Settlements, Annual Economic Report 2026, Chapter I, June 28, 2026.
[44] Financial Times, reporting on banks seeking to offload AI data-center construction debt, May 2026.
[45] Hilary M. Felson, “Closing the Book on Jusen: An Account of the Bad Loan Crisis and a New Chapter for Securitization in Japan,” Duke Law Journal 47:567-612, 1997.
[46] TIME, “Japan’s Trillion-Dollar Hole,” April 8, 1996; Ulrike Schaede, “The 1995 Financial Crisis in Japan,” BRIE Working Paper 85, 1996.
[47] Ministry of Finance tokkin rule changes (1983 to 1984) and market size estimates; contemporaneous Japanese financial press.
[48] Baltimore Sun, “Tokyo Brokerages Release List of Clients Who Got Payments,” July 30, 1991.
[49] Toshiro Shimoyama, quoted in Nikkei, 1986.
[50] Olympus Corporation third-party committee report, 2011; contemporaneous coverage of the tobashi loss concealment.
[51] Òscar Jordà, Moritz Schularick & Alan Taylor, “Leveraged Bubbles,” Journal of Monetary Economics 76, 2015 (NBER Working Paper 21486).
[52] Moritz Schularick & Alan Taylor, “Credit Booms Gone Bust: Monetary Policy, Leverage Cycles, and Financial Crises, 1870-2008,” American Economic Review 102(2), 2012.
[53] Tomohiro Hirano & Alexis Akira Toda, “Bubble Necessity Theorem,” Journal of Political Economy 133(1):111-145, 2025; working paper version arXiv:2305.08268.
[54] Hirano & Toda, “Bubble Economics,” Journal of Mathematical Economics 111, 2024, §1.1 (citing Nikkei Business, October 23, 2000, for the Kaneko/Marusan letter).
[55] “Boom, Bubble, or Buildout? Making Sense of the AI Investment Surge,” arXiv, June 2026.
[56] Lev Breydo, “Closed Circles: Is AI Infrastructure the Next Systemic Risk?”, SSRN Working Paper 6979299, 2026.
[57] CloudZero, “H100 GPU Cost in 2026: Buy, Rent, and Cloud Pricing Compared.”
[58] Silicon Data, “The Illusion of Stability: Unpacking H100 GPU Market Value Trends”; Silicon Data H100 Rental Index.
[59] Amazon.com Inc., Alphabet Inc., Meta Platforms Inc. and Microsoft Corp. annual and quarterly filings, useful life disclosures, 2024 to 2026.
[60] Michael Burry, public commentary, November 11, 2025, as reported by CNBC, “’Big Short’ Investor Michael Burry Accuses AI Hyperscalers of Artificially Boosting Earnings.”
[61] US House Committee on Financial Services, report on the Global Crossing bankruptcy, March 21, 2002; contemporaneous bankruptcy filings and coverage.
[62] Nobuhiro Kiyotaki & John Moore, “Credit Cycles,” Journal of Political Economy 105(2), 1997. Note: the quantitative magnitude of amplification in the baseline model is contested (see Córdoba & Ripoll, 2004).
[63] Gary Gorton & Andrew Metrick, “Securitized Banking and the Run on Repo,” Journal of Financial Economics 104(3), 2012.
[64] Tobias Adrian & Hyun Song Shin, “Liquidity and Leverage,” Journal of Financial Intermediation 19(3), 2010; “Procyclical Leverage and Value-at-Risk,” Review of Financial Studies 27(2), 2014.
[65] Nippon.com, “Tracking the Legacy of the Employment Ice Age,” March 15, 2023.
[66] Yahoo Finance, “Japanese Companies Are Paying Older Workers to Sit by a Window and Do Nothing,” February 27, 2026.
[67] Mitsubishi Estate acquisition of Rockefeller Group (1989) and the 1995 mortgage default; contemporaneous New York Times and Wall Street Journal coverage.
[68] Morgan Stanley, “Mitsubishi UFJ Financial Group to Invest $9 Billion in Morgan Stanley,” September 29, 2008.
[69] Capital Misallocation Database v3.1, Cases #18 and #49. Deductive Capital.
Keep reading with a 7-day free trial
Subscribe to Capital Misallocation to keep reading this post and get 7 days of free access to the full post archives.