Spot Bitcoin ETFs Launch - Week 1 Review
Last week marked a significant milestone for Bitcoin as it effectively had its "IPO" with the launch of 11 spot ETFs trading in the USA after receiving long awaited SEC approval last Wednesday in a 3-2 decision. If you are an active Twitter/X user you know that it was impossible to avoid discussion of this event as predictions and opinions filled your wall. Bulls argued that the “mountain” of demand would drive the market higher given the low float relative to massive demand from traditional asset managers. Bears argued that the 200% price appreciation since December 2022 and large build of open interest in futures markets implied that it would be a “sell the news” event.
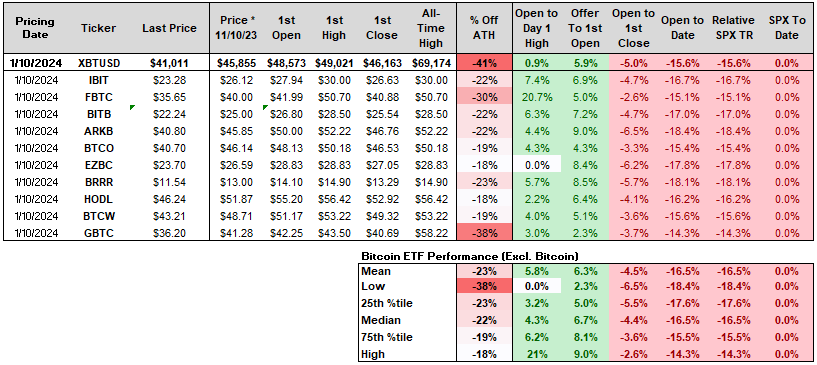
On January 10th the SEC granted approval after the close and then all of the ETFs set their NAV at a reference price of Bitcoin of roughly $45,855. The Bitcoin price started climbing overnight hitting $48,573 at 9:30am EST when the US stock market opened. It briefly climbed above $49,000 in the first 30 minutes of trading driving ETF bulls to get a little cocky like the tweet seen below.
How It Started
How Its Going
Ever since the open on January 11th, Bitcoin has traded down 16% with most of the decline coming in the first 48 hours. Given that the S&P 500 is flat over the last week we can confidently say that this was a “Sell the News” event as anticipated by your author as well as many others.
But this shouldn’t come as a surprise because when we look back over time we have seen local peaks occur right around the introduction of a traditional finance trading vehicle.
In addition, Bitcoin open interest in both the CME Futures and offshore crypto exchanges had ramped up from $10 billion to roughly $19 billion the morning that the spot ETFs started trading. This doesn’t even include the sizeable amount of option open interest on the Derabit market or open interest in various other crypto products. Nonetheless, since the peak on January 11th we have seen open interest drop by $3 billion. Note that the previous peaks always saw large run ups in open interest into the peak and fall sharply afterwards along with the price.
Lets Look Under the Hood at the Flows
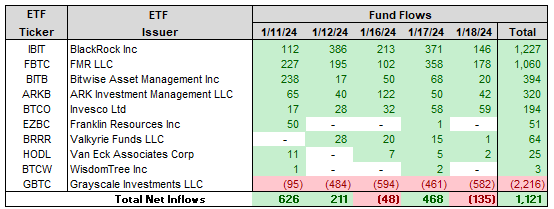
The first 5 trading days saw a lot of trading volume but a mere $1.1 billion of net inflows. Looking under the hood, we see a clear trend of money is flowing out of the high fee (1.5%) GBTC, the original spot Bitcoin vehicle in the equity market, into the lower fee new ETF competitors.
Overall, commentators have proclaimed the launch as one of the most successful ETF launches in history. Not sure the guys who bought it on the open last Thursday look at it that way given the price performance. Also, considering that we have seen net outflows from the complex in 40% of the trading days thus far its hard to proclaim it was a smashing success.
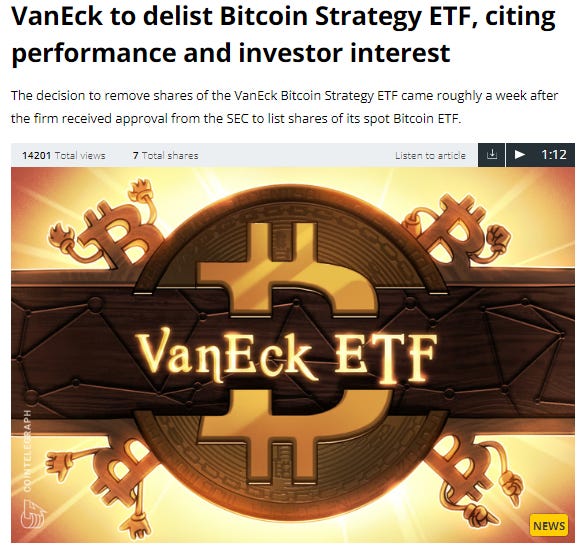
In fact, it was just announced that Van Eck will be shutting down its product (HODL) already given disappointing investor interest. To be fair, ETF assets follow a power law and obey a “Winners Take All” dynamic so I don’t think it is surprising that the issuers that fail to gain share will pack up shop and call it quits. I would expect a few more exits before too long.
How Does This Compare to History?
It is clear that the initial performance for both Bitcoin and these funds has been quite lackluster. However, I think it is good to put this in historical context. So I decided to take a stroll down memory lane and revisit the most monumental public market introductions from the past to see if there is a typical playbook for these type of events. Below we will evaluate the re-introduction of gold ownership to US public in 1975 as well as the largest IPOs from 2007 to 2022.
An Appropriate Song to Accompany Your Read by Jay-Z
1975 Gold Reintroduction
Bitcoin is often referred to as “Digital Gold” and so it seems appropriate to go back and look at what happened when gold ownership was once again made legal for US citizens for the first time in 41 years on January 1st 1975.
For way of reference, in 1933 the US government ended the gold standard and enacted Executive Order 6102 making it illegal for US citizens to own gold. After WW2, the global powers descended upon Bretton Woods, NH and agreed upon a new global monetary system that became known as the The Bretton Woods System. This monetary regime required countries to guarantee convertibility of their currencies into U.S. dollars to within 1% of fixed parity rates, with the dollar convertible to gold bullion for foreign governments and central banks at US$35 per ounce. Given that the USA owned over 2/3 of the world’s gold at that point and was set to be the largest economy in the post-war period this system was ratified. Then on August 15th 1971 President Nixon suspended convertibility to dollars as French President Charles De Gaulle continued to call in gold rendering the US Dollar a true fiat currency for the first time.
Even though it was no longer pegged after Nixon’s action, gold remained illegal for US citizens to own until January 1st 1975. In anticipation of strong demand there were a lot of players hoarding gold in anticipation of large demand for US investors.
However, just like the two introductions of Bitcoin ETFs the hype missed expectations and gold proceeded to drop 44% bottoming in August 1976.
“Americans were legally em powered a year ago to buy gold bullion for the first time in 41 years. Consumers were bombarded with offers of gold ingots and coins, and promoters held out visions of a gold bar under every mattress.
Today, buyers who took advantage of their new freedom to own gold have lost as much as 40 percent on their original investment. Furthermore, some sellers of gold bullion have gotten out of the business, and many gold‐mining securities have declined in value—even in a sharply rising stock market.” (NY Times, 1975)
If you are interested in more anecdotes and color around this event I recommend reading this 1975 NY Times Article that ran on December 31, 1975. There are a number of nuggets in there that echo the recent Bitcoin experience.
Performance of Big Financial Asset Introductions
This list represents the performance of the most anticipated IPOs spanning the previous 20 years along with the performance of Gold since its effective IPO on January 1st 1975. It is like a trip down memory for your author as I personally participated in almost every single deal from the institutional side. It is beyond the scope of this piece but I could provide detailed stories and color on each and every deal.
Performance Analysis
Here are a few takeaways from conducting this analysis on all these major market introductions performance initially and over time. This represents 14 major deals with offer sizes ranging from $2bn to $25bn within the USA. There are other foreign deals and older deals in the USA but I think that this gives a good sample for comparing the Bitcoin ETF.
Over the long term these large deals have a fat-tailed distribution with very big winners (Visa, Meta, HCA) and a few large losers (LYFT, SNAP, RIVN, BABA) from open price to date total return perspective. The win rate is basically a coin flip so what this implies is that you need to do your homework if you plan to buy the open.
Takeway #1: Flipping IPOs = Good Living
Insiders and good bank clients that have access to IPO shares usually take the shares as they view it as a rebate as it is often free money, especially on marquee deals like this list. Buying these IPOs at deal price and selling at the open is the best strategy there is in all markets as it boasts a staggering return profile, which is why everyone fights to get as many shares as possible on “hot deals”.
Buy the Deal & Flip at the Open Return Profile
Win Rate: 93%
Mean Return: 36%
Median Return: 28%
Return Range: 117% upside vs -7% downside
Takeway #2: Don’t Buy the Open
In contrast to the Wall Street insider strategy above, the retail public often buys the open as they eagerly anticipate an opportunity to own the shares of such a high profile company. The problem here is that most of the time you are exit liquidity for the insiders mentioned above flipping you there shares in the short term and exit liquidity for the private equity / VC insiders over the first year. In addition, these deals historically have come to market close to or right near the top of the market cycle. Older market participants clearly remember Blackstone marking the top of the credit cycle during 2007 or Rivian marking the top in 2021 for both the market and the clean tech bubble.
We see these two realites play out in the numbers as detailed below. Specifically, only 21%, 29%, and 14% of these deals posted a positive return on a 1 day / 1 week / 1 year holding period respectively. To make it worse only 1 DEAL (7% of sample) outperformed the S&P 500 over the first year if you bought the open. So overall, buying the open means that you better be ready to hold the security and hope that you did your homework as the long-term win rate is a coin flip at a 57% win rate in absolute and relative to S&P 500 terms.
Buy the Open Day 1 Return Profile
Win Rate: 21%
Mean Return: -3.2%
Median Return: -3.6%
Return Range: +3.6% upside vs -10.3% downside
Buy the Open Week 1 Return Profile
Win Rate: 29%
Mean Return: -2.5%
Median Return: -2.4%
Return Range: +36.8% upside vs -24.1% downside
Buy the Open 1Y Holding Period Return Profile
Win Rate: 14%
Mean Return: -25%
Median Return: -27%
Return Range: +32% upside vs -74% downside
Takeaway #3: Better To Wait
If you aren’t able to gain access prior to the first trade, the better strategy is to wait for 2 to 6 quarters to buy. A typical IPO only floats 15-20% of the total shares outstanding and carries a 180 lockup period for insiders to make their first sales. This is done to improve the chances of trading success off the jump and to facilitate Follow On offerings for insiders.
So the reality is that when an asset comes to market with a large market cap and is very public you can expect the people invested in it prior to create a “well-supplied” market. This usually leads to poor performance out the gate, evidenced by the mentioned performance over less than a year time periods. With only 14% of deals bought at the open boasting positive returns and the sample sporting a pathetic -27% median return its clear that waiting is the superior strategy.
If you simply waited a year to buy these deals you dramatically improve your long term returns.
Win rate improves to 64% from 57% on an absolute basis and from 21% to 36% on a relative basis.
LT IRR improves from -2% to 4%
The risk reward improves with your downside going from -85% to -54% while seeing the right tail of the distribution expand as well.
To summarize - your probability of winning improves materially, your average expected return improves massively, and the distribution of outcomes moves in your favor as well. The takeaway is that you need to wait until the market becomes more balanced in order to increase your chances of success.
Conclusion: Don’t Writeoff Bitcoin Yet
When viewed through this historical context it is apparent that deals doing poorly initially is The Rule rather than The Exception. Bitcoin is unique in that its actually been publicly traded since its inception - one of the reasons its “Hodlrs” love it so much as they have become rich.
Bitcoin being down 16% since the open last week puts its performance in the bottom quartile of this sample. Yet, the two deals that were worse were META and BX, which went on to generate superior returns over the long run.
Time will tell if the bulls or the bears are ultimately right, but I personally think that Bitcoin and crypto in general will be fine in the long term just like META.
I will leave you with a META anecdote as I received a very large allocation on that deal and really was bullish. However, they mishandled the deal and priced it at $38 when they should have priced it at $34. Once the selling started it was obvious to me the trajectory of the stock and I sold for a $2 per share profit. Luckily I followed my own advice above and was able to get back in the $20s after it clearly had bottomed and rode the stock for a few great years.


I saw you've posted about the MSTR premium. What do you think about the following trade?
1. Sell June 2025 calls at $3,150 strike. Current premium ~$600 (40% of MSTR's stock price
2. Buy BTC at 1 to 1 ratio (~$152k BTC for every MSTR call)
You win in the following:
1. Premium stays flat and BTC increases
2. Premium decrease and BTC increase
3. Premium stays flat and BTC decreases less than 40%
You lose in the following
1. Premium increase (MSTR has to ~2x)
2. BTC goes down by greater than 40%
I may not be seeing something with the options, but it seems like over 2 years you get a free ride to 100% gains if BTC goes up and a 40% cushion from the premium if BTC goes down. The world were BTC is up and MSTR premium is also up in 2 years seems small to me. Path dependency does make this a little tougher to analyze though...
Feel free to DM me and we can discuss if you like